You are using an out of date browser. It may not display this or other websites correctly.
You should upgrade or use an alternative browser.
You should upgrade or use an alternative browser.
Articles
Filters
Show only:
Loading…
Have you heard the one about the poor guy who ends up lost in a minefield? Having no clue what to do, he prays, covers his eyes and walks a straight line. Miraculously, he survives. Brimming with confidence, he is convinced that if it happens again, he will employ the same technique to survive. Well, you can figure out the rest of the story. Boom. It’s just too obvious. That guy was simply on borrowed time.
This ‘guy’ could be any number of traders, including you, who trade in the same style. Finding themselves in that proverbial minefield with huge intra day losses. In a fit of desperation, they put on crazy Hail Mary trades with double, triple, and quadruple the normal size just looking for that miracle. You also know the ending to...
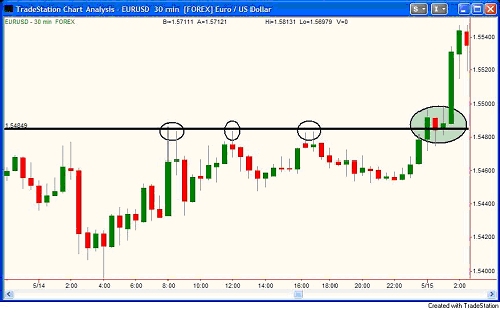
Over the past weeks, I have focused my weekly articles on strategies. I have tried to share with you the various strategies I see traders using and finding success with. Today, we will end the strategy series with far and away the most popular entry strategy, the "breakout". The Forex markets are markets that move. In a market that has significant and consistent movement, using breakouts is very appropriate. As with any strategy, there is a right way to understand and use it and a wrong way. In this piece, I will discuss the two most popular breakout entries; Support and Resistance Breakouts and Trend Line Breakouts.
Support and Resistance Breakouts
Once in a while I hear someone say that breakout trading worked best in the late 90's...
As a trader and educator, I have come across thousands of traders during the past 15 years. I can honestly say that I have never met or seen one trader be able to sit down in front of a screen each morning without a trading plan, look at a few charts, start trading, and make money consistently year after year. I am not saying it's not possible, I have just never seen it. The people you see do well have a trading plan. Of that group that does well, it is typically the people with the short, simple trading plans that do the best. The key is making sure your trading plan is yours and works for you. Make sure it ensures that almost everything that can be a rule, is a rule. These don't have to be the best rules, the fact that they are rules...
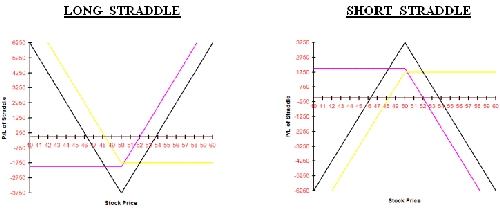
Over the last few months I've discussed a lot of the basics of trading options. It's like building a house; you start with the foundation. As far as actually trading, I've discussed Puts and Calls and a little bit about Covered Calls. Now we're going to start thinking about different types of spread strategies. Why do we want to spread? Several reasons; it reduces the overall cost and limits the risk of a position. At the same time it lowers the breakeven point for the position and allows flexibility to take advantage of different types of market conditions. Of course, like everything else in trading, there is a trade-off. The maximum potential on the upside may be capped, and there will be more commission costs and more bid/ask spreads...
The new high/new low ratio (NH-NL) ratio has been around for many years but different investors use this indicator in different ways. Some investors plot the ratio on a chart using the number zero as a neutral designation with positive numbers equaling more new highs than new lows and a negative number equaling more new lows than new highs based on a specified period of time. I have developed and used the NH-NL ratio in a completely different way from some of the more popular methods. I started to follow stocks making new highs while reading the paper Investor's Business Daily many years ago. I didn't use the news highs as an indicator but I only studied stocks to buy from the list. As I became a more experienced investor, I...
Traders spend most of their time researching setups for trade entry, using fundamental analysis, chart patterns, signals from technical indicators, or some combination of these.
Yes, no doubt about it, finding entries is vitally important, because the entry is the foundation upon which a trade is built. However, if finding good entries is the most difficult thing, finding good exits is the most emotionally challenging part of the trading process!
Winning or losing, deciding on the exact time to close your trade can drive you nuts.
Common exits occur when traders get stopped out at a stop loss level, close the trade into high volume spikes, or attain predefined targets.
All trades should have a stop loss in place. Some traders hold a...
In order to be a successful trader - and not fall into the trap of so many - it is important to take good advice and remember that, sometimes, others do know best! Here are the Top 10 tips for successful trading. Follow them closely (or at least to an extent) and you should stand a good chance of becoming an accomplished spread bettor.
ALWAYS stay in control
Winners are always in control; both mentally and emotionally.
Losers aren't. Losers are sometimes guided by emotions - This will lead to you making bad decisions!
'Plan the trade, trade the plan'. Always stick to the original plan. Deviations will invariably lead to an error.
Take responsibility for results
Winners are can sometimes lose! But most of the time they win and...
To get a computerized system edge, you need to figure out the basic human trading weaknesses and include them in your software. Anyone can buy a trading system these days, but it will have little value unless it is unique and different from the crowd. Here's some easy-to-understand ideas I use that add in the human fears!
These days it's very easy to put together a computerized commodity trading system. The average software program will literally write and optimize itself. You can buy a "black box" that will give you wonderful claimed performance. But what does that tell you? If anyone can do it, then it's of little value and uniqueness in the market and will become a loser over time. To get an edge, you need to figure out the human...
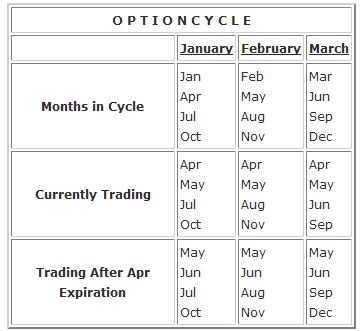
Tomorrow, the 18th April 2008, is the 3rd Friday of the month, commonly referred to as expiration Friday. Coincidentally, this year it almost coincides with the first day of the Jewish holiday of Passover. I therefore find it appropriate to ask "Why is this day different than other days?" (If you don't get the joke, and care to, send me an email.)
The truth is that technically the expiration is on the Saturday following the third Friday, but you can't trade the options after the close on Friday. Also, if you want to exercise an option that is in-the-money (ITM) by less than a nickel, or not exercise an option that is ITM by a nickel or more, you must notify your broker by 5:30 pm (EST) on Friday. Some brokers require this notification...
I love Thursdays in our Professional Trader class. That is the day we discuss Fibonacci numbers and how to use them. It still amazes me when I realize how well these Fibonacci numbers work. You can use them to measure price retracements and projections for new impulses. These levels will give you possible support and resistance levels at which traders can enter trades and/or take profits. The first part of using the Fibs as they are known is to identify the cycle or impulse in the stock, Forex pair, E-Mini or whatever you are trading. The cycle or impulse is the predominant direction and thrust of the security. We commonly call it the trend. In our classes we also teach how to identify the impulsive and corrective environments and what...
The title of this article alone is likely to raise the hairs on the back of many necks. The thought of pushing away concepts and ideas used for decades may sound ludicrous to you, but allow me to elaborate.
Old and proven ideas should never be pushed aside. Rather, the old ideas that have not proven effective and have prevented many from progressing towards a positive goal, these need to be shed. And there are plenty of them.
Some of these old ideas are that the futures and commodity markets cannot be forecasted because the patterns are random. Other old ideas are that you cannot make a success at trading unless you know the fundamentals of the market you wish to trade. And there is the old ideas that to make a success you must depend...
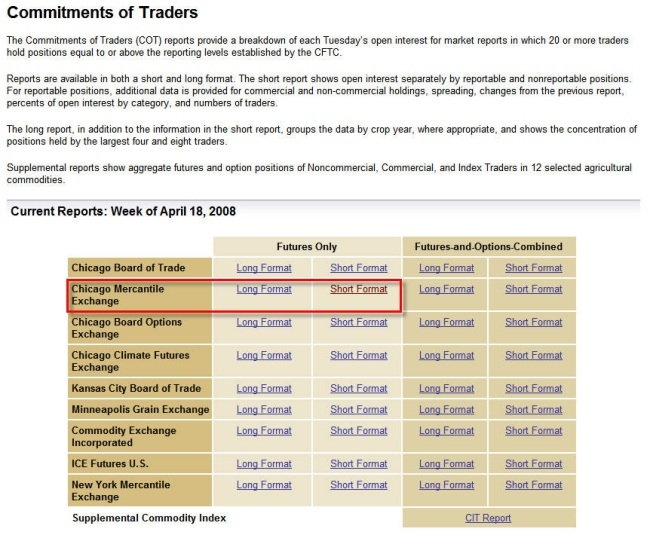
Many traders are seeking out assistance in their trading decisions from decision support tools we call technical indicators. While these are helpful, they are only to be used as support for our decision to buy where demand outstrips supply or to sell when supply overwhelms demand. We see this supply/demand imbalance on our charts as support and resistance. However, there is another useful data set that is independent of price that will give us clues as to the possible future of the markets. This data can be found in the Commitment of Traders report.
The Commitment of Traders (commonly referred to as the COT) report has been published by the Commodity Futures Trading Commission since 1962 and provides information on the open...
Whether I am trading or instructing a stock, futures, or options class, our lowest risk and highest reward trade each day is typically the opening gap entry. As soon as I suggest the trade to the class, someone always says: "I was told we are not supposed to trade the open because it is not for the novice trader". That is not exactly what we say. What we say is that the open is not for the novice trader. It is, however, a fantastic opportunity for the astute trader who knows how to identify a novice trader. Most of the time, our entry is within seconds to minutes of the opening bell. There is a reason for this?
Why do prices gap up? They gap up because there are more buy orders at the open than there is available supply at the prior...
You go long and the market immediately goes down - you go short and the market immediately goes up. That's 2 consecutive losses, and you are getting a little 'anxious' so you don't take the 'next' trade. Of course, this trade is a winner. Now to make the situation worse, you then 'chase' the move, and as soon as you enter the trade it immediately reverses, thus giving you another loss - this is now 3 in a row. Ok one more "try" - this can't happen on every trade can it?
This time though, you will be real clever. You have noticed that the market is in a range, and it's the bounce from the low/retrace from the high that is causing all the problems. So this time, the next trade you take will be a range extreme fade AND the hell with your...
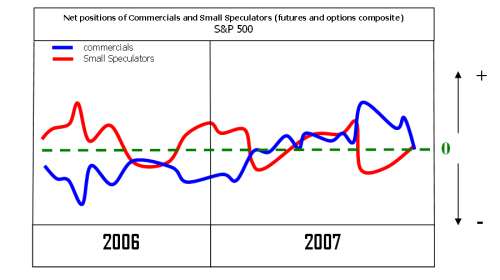
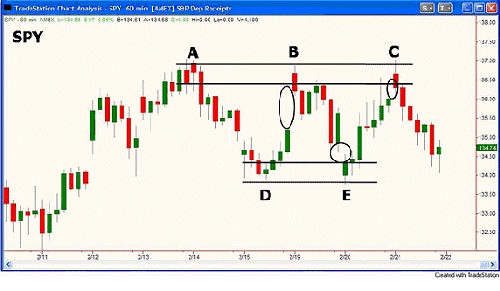
The end of 2007 was characterized by extreme values in various indicators of stock market analysis. In this article I will review and analyze four of them. I will use the term "indicator" here not necessarily according to the technical analysis jargon but rather as a set of clues (either measurable or not) under the same idea which can reveal specific internals of the stock market and imply bullish or bearish projections.
The First Indicator: Commercials Versus Small Speculators
The Commodity Futures Trading Commission releases weekly information known as Commitment of Traders (or simply COT) report about various markets which can be used to approximate the net open interest for futures and options in each of the following three...
Within technical analysis, the examination of volume should always be hand in hand with examination of the trend and other technical patterns. Many traders ignore volume at their peril, and strangely enough there are very few volume based indicators compared to the many hundreds of price based signals available on current trading software. Although volume has great relevance to trading signals, price action is though always the ultimate determinant of buying or selling decisions.
On-balance volume
The most popular indicator until very recently, and the one featured on most software, is called 'On Balance Volume', which is simply a running total of volume. This simple indicator aims to highlight if volume is flowing into or out of a...
We all know emotion can be the devil in your trading career. Often, it is emotion based decisions that keep people from even having a trading career longer than a few months. While emotion often has you buying signals way after a move higher in price which is likely near resistance which almost ensures a losing trade, there is another culprit that leads to the same losing behavior in trading. It is the misuse of indicators and oscillators.
Understand that the movement in price in any and all free markets is a function of the pure laws and principles of supply and demand. Opportunity exists when this simple and straight forward relationship is out of balance, period. What most people don't understand is that when you ignore a governing...
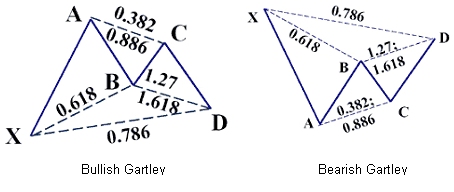
Once in a while a pattern comes along discovered by little known trader that stood the test of time can be a useful tool to trade even in this modern-day markets. It only goes to show the validity of the pattern's profitability factor.
This is a complex pattern that beginners may have a hard time finding them in their charts. Identifying double-top, double-bottom, triangles are easy. Then head-and-shoulders come in many shapes and sizes, these take more time to spot them. But the Gartleys are more complex in a sense that Fibonacci measurements must be taken into account unlike the traditional patterns. This pattern is also known as the Gartley Butterfly because of the movements of the prices and the drawn lines that connect to other...
Much has been written about the current bull market in gold and how it compares to previous moves, in particular during the 1970s when the metal soared to at the time unimaginable heights.
On this basis it is worth looking at the background to the value story on gold, and this may shed some light on why its bull market may have significantly further to go for CFD traders in coming years.
The Gold Standard
The UK, which at the time was the world's dominant economic powerhouse, adopted a gold standard in the early 19th century. Other currencies then looked to have gold backing, and towards the end of the century, various European countries joined the standard, though some chose for a time use a joint gold and silver standard.
The...
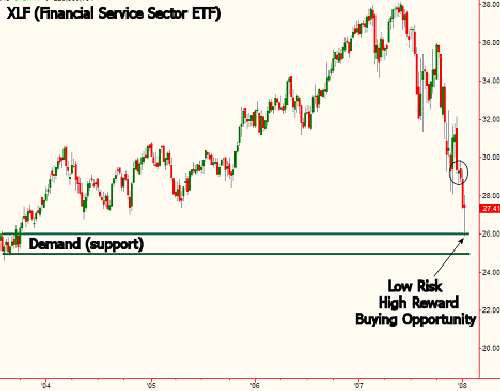
Recently I showed some students a chart of the XLF which is the ETF for the financial service sector. I showed a demand (support) level and suggested this would be a low risk area to buy the XLF for a bounce, not a long term trade. After receiving many questions on this trading opportunity from people who bought the XLF as planned and from those who didn't, I thought it would be a good idea to revisit the chart as the questions in the emails were all the same.
As you can see below, price in the XLF touched our level on 10th January 2008. For those who bought it then, the trade had a gain of $2.00 in the past two days, congrats. You can certainly move your stop to breakeven at this point and consider exiting some or all of the position...
Paper trading is widely discussed regarding its merits, and whether it is of value to a trader as they try to make the transition to real money trader. One viewpoint is that since paper trading is not real, the profits are meaningless, and are no indication of real money profitability. An opposite viewpoint would state that paper trading is an important step in the trader's learning progression, and regardless of whether it is real, if the trader cannot "properly" paper trade, then they will not be able to real money trade.
I began trading in early 1995, with the intentions of becoming an options trader; my first trading education was through an oex options teaching service. Besides options training, the service included "tape"...
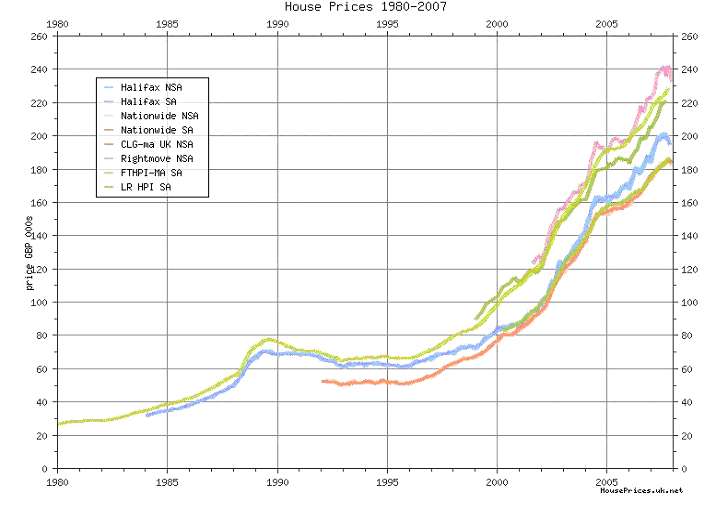
Recently the IMF said that the UK's property was overvalued and this could result in a spectacular slump. House prices in the US have slowed down considerably since 2005.
The UK avoided the Recession in 2001 when many countries went into deep recession. Post 9/11 the UK interest rates were at the lowest for many decades, this resulted in a boom in the UK housing market as the cost of mortgages was at its lowest. The low cost of borrowing also saw a boom in the buy to let market with many investors having a big portfolio of properties.
Not only was the UK government on a spending spree but also the UK consumer, due to the easy availability of credit. Currently the UK personal debt level has exceeded more than £1 trillion. It is...
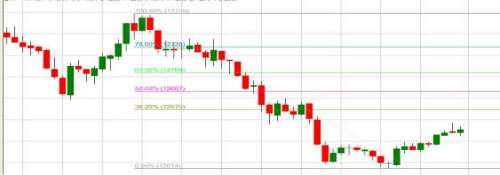
Fibonacci Retracements - A Precision Trading Strategy
Deciding on a topic for this article, I reviewed the top ranked articles in T2W and found some fantastic material. I did not however find inspiration for a new article idea that readers may like. Perhaps strangely, I then looked at the lowest rated articles. I noticed that two of them discussed Fibonacci which both surprised and intrigued me. It was not necessarily that people did not like Fib, just that perhaps it had not been explained well enough for their liking. I am a huge Fibonacci fan and it plays a big part in my trading so the following will explain how I use it to trade successfully.
While this strategy can be applied to almost any market, I will focus on the Dow Jones...
The following interview was originally published in Trader's Journal (TJ) November 2007 issue and is reproduced with their kind permission.
Part I: On Trading
TJ: John, when and how did you get started into trading?
JD: I got started in 1968 as a biology and physics teacher in Milwaukee, Wisconsin. I was the Director of the teacher investment club with a $100 per teacher contribution in a pool and some hopes and dreams. I read Harry Browne's book in 1970 about Nixon closing the "gold window" for the USD. The title of Harry's classic book is How to Profit from the Coming Devaluation and it changed my life and all I have touched in this space forever.
TJ: What did you find trading interesting?
JD: The daily intellectual challenge of...
In this article I will explain to you how to develop a profitable day trading system in five steps:
Let's take a closer look at these steps.
Step 1: Select a market and a timeframe
Every market and every timeframe can be traded with a day trading system. But if you want to look at 50 different futures markets and 6 major timeframes (e.g. 5min, 10min, 15min, 30min, 60min and daily), then you need to evaluate 300 possible options. Here are some hints on how to limit your choices:
Though you can trade every futures markets, we recommend that you stick to the electronic markets (e.g. e-mini S&P and other indices, Treasury Bonds and Notes, Currencies, etc). Usually these markets are very liquid, and you won't have a problem entering and...
Introduction
In this article we'll take a look at two related practices that are widely used by traders called Backtesting and Data Mining. These are techniques that are powerful and valuable if we use them correctly, however traders often misuse them. Therefore, we'll also explore two common pitfalls of these techniques, known as the multiple hypothesis problem and overfitting and how to overcome these pitfalls.
Backtesting
Backtesting is just the process of using historical data to test the performance of some trading strategy. Backtesting generally starts with a strategy that we would like to test, for instance buying GBP/USD when it crosses above the 20-day moving average and selling when it crosses below that average. Now we could...
Are you like many investors who go to sleep each night feeling safe and secure because their investment portfolios are properly diversified? Conventional diversification attempts to decrease risk and offer more opportunity for the average investor. However, when we observe conventional diversification protocol through the objective eyes of pure supply and demand, it becomes quite clear that conventional diversification actually increases risk and decreases opportunity.
The Foundation: Quantify Supply and Demand
As I have repeated so many times, the movement of price in any and all free markets is a function of the laws of pure supply and demand. Low risk/high reward buying and selling opportunity emerges when this simple and straight...
Does your trading lack the "trader's edge" needed to be a consistent winner in the markets? Do you find yourself entering and exiting positions at the very wrong time? If the answer is yes, you're not alone. The good news is that there is a very specific reason why the majority of traders enter and exit trades with very poor timing. Also, the answers needed to fix this problem are far simpler than you may think. To gain the edge and learn how to stack the odds in our favor, we will go back to the school of basics, not just to review the basic concepts but more importantly to look at them very differently than we have before. We know that if we look at charts, indicators, and any other tools used to perform market analysis the same way...
When it comes to trading, one of the most neglected subjects are those dealing with trading psychology. Most traders spend days, months and even years trying to find the right system. But having a system is just part of the game. Don't get me wrong, it is very important to have a system that perfectly suits the trader, but it is as important as having a money management plan, or to understand all psychology barriers that may affect the trader decisions and other issues.
Most Forex trading courses and Forex training programs forget about these important aspects of trading. But the truth is that in order to succeed in this business, there must be a complete equilibrium between all important aspects of trading.
In the trading...