You are using an out of date browser. It may not display this or other websites correctly.
You should upgrade or use an alternative browser.
You should upgrade or use an alternative browser.
Articles
In this article, I decided to discuss a simple technique that is often overlooked when traders are reading charts. We are all too quick to look at the squiggly lines that we call indicators and oscillators and dismiss the simplest signal available to us which at the simplest level would be ‘PRICE!’ Price is most commonly displayed for most traders through candle charts. If you are not familiar with the construction of a candlestick, I have included a quick reference below. A green candle usually indicates strength in price and is formed by price closing higher than it opened during that particular time period. Conversely, the red candle indicates weakness due to the closing price being lower than the open for that period.
The problem...
When trading we look to short in supply zones during downtrends and go long in demand zones during uptrends. Easy enough, right?
Theoretically, yes, but the main question is "Which time frame are you using to determine direction?" This week's lesson is specifically applied to you day-traders out there.
First off, let's define a day-trader who, for example in the stock market, is someone who enters and exits the trade in the same trading day, buying 1,000 shares of XYZ in the morning and selling those 1,000 shares in the afternoon.
In the spot forex market, the trading day isn't as clearly defined. For this lesson, we will assume you are looking to be in a trade for a few minutes to a few hours and trading from a 15-minute chart...
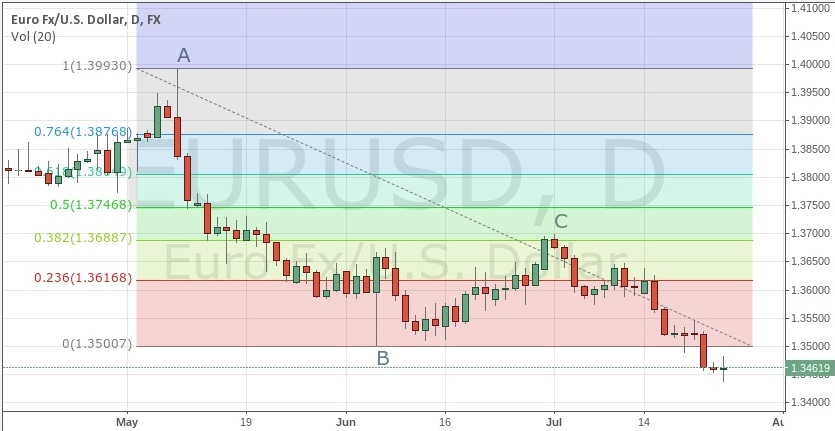
One of the most perplexing areas of trading is identifying trends early enough to still have low-risk, high-reward entries. Every book ever written on trading has told us that we should always align our buying or selling in the direction of the trend, and that this is the key to trading success.
In some respects, that may be true, however, most of these books fail to make three very critical distinctions:
When is it too late to join the trend?
What trends are the most important?
When are trends likely to reverse?
To answer these questions, let's first think in terms of keeping it simple and what would cause a trend to end. First, trends in the shorter term are continuously changing.
Shown below is a ten-day look back at a...
Some traders and investors denounce technical analysis (TA) as a superficial study of charts and patterns without any concrete, conclusive or profitable results. Others believe it is a sort of “Holy Grail” that once mastered will unleash sizable profits. These opposing viewpoints have led to misconceptions about technical analysis and how it is used.
Some misconceptions about technical analysis are based on education and training. For example, a trader trained in using only fundamentals may not trust technical analysis at all. But that doesn't mean someone who is trained in technical analysis can't use it profitably. Other myths are based on experience. For example, the incorrect use of technical indicators often leads to losses. That...
Acquiring additional knowledge is not always beneficial when trading financial markets because some information can make us more ardent in our views and opinions, so we make bold predictions that turn out wrong. And incorrect predictions can be costly when real money is on the line, especially when we take positions against the prevailing price movement and in anticipation of a quick and sharp change in price direction, but then the reversal never happens.
Investors, especially short-term traders, are usually better off waiting for the movement in price to confirm a trend or reversal rather than try to predict what is going to happen next. Section two of this article looks at some ways we can rework our thinking to gain a better edge...
The 50-day moving average marks a line in the sand for traders holding positions through inevitable drawdowns. The strategy we employ when price nears this inflection point often decides whether we walk away with a well-earned profit or a frustrating loss. Considering the consequences, it makes sense to improve our understanding about this price level, as well as finding new ways to manage risk when it comes into play.
Formula
The most common formula takes the last 50 price bars and divides by the total. This yields the 50-day simple moving average (SMA) used by technicians for many decades. The calculation has been tweaked in many ways over the years as market players try to build a better mousetrap. The 50-day exponential moving...
Starting out in the trading game? Looking for the best technical indicators to follow the action is important. It affects how you’ll interpret trends - both on positions and in the broad averages - as well as the type of opportunities that pop up in your nightly research. Choose wisely and you’ve built a solid foundation for success in speculation. Choose poorly and predators will be lining up, ready to pick your pocket at every turn.
Most novices follow the herd when building their first trading screens, grabbing a stack of canned indicators and stuffing as many as possible under the price bars of their favorite securities. This "more is better" approach short circuits signal production because it looks at the market from too many...
Elliott and Gann have become household names among the worldwide trading community. These pioneers of technical analysis developed some of the most widely used techniques in the field. But how did Ralph Nelson Elliott and W.D. Gann come up with these techniques, and how did they become so successful? Truth be told, it's not as difficult as it sounds! This article takes you through the process of building your own custom indicator, which you can use to gain an edge over the competition.
Background
Recall that the theory behind technical analysis states that financial charts take all things into account – that is, all fundamental and environmental factors. The theory goes on to state that these charts display elements of psychology that...
Elliott Wave Theory was developed by Ralph Nelson in the 1920s. Nelson found that financial markets have movement characteristics that repeat over and over again. These movements are called waves and Elliott Wave Theory is a broad and complex topic, taking practitioners years to master. Despite its complexity, there are elements of Elliott Wave that can be incorporated immediately and may help improve analytical skills and trade timing.
Impulsive and Corrective Waves
Source: www.tradingview.com
Prices move in impulsive and corrective waves. Knowing which wave is likely underway, and what recent waves were, helps forecast what the price is likely to do next.
An impulse wave is a large price move and has associated trends. An...
Whether you consider yourself a technical analyst or not, there are very few investing techniques that do not at least give a nod to the technical side of investing. Some investing styles use nothing but technical analysis, with their practitioners often claiming that they know nothing of stock fundamentals because all they need is in the charts. This segment of investing didn't sprout from nothing and in this article we will look at the men that pioneered the field of technical analysis.
All Things Flow from Dow
Charles Dow occupies a huge place in the history of finance. He founded The Wall Street Journal – the benchmark by which all financial papers are measured – and, more importantly for our purpose, he created the Dow Jones...
Most traders and investors are familiar with the saying "the trend is your friend." But deciding what constitutes a trend often proves challenging because it depends on the trader's preferred time in the trade. Furthermore, once a trend has been identified, the trader must determine its strength.
In his book "The Logical Trader," Mark Fisher describes a number of techniques to help his reader spot trend breakouts and identify their strength. Fisher's ACD trading system uses intraday data to identify the daily opening range for finding trades. Fisher, an independent trader, is the founder of MBF Clearing Corp., one of the largest clearing firms on the NYMEX.
While this intraday ACD technique may not appeal to the long-term trader or...
Channels provide a simple and reliable way for traders to define their entry and exit points within an equity. Although the basic channel-trading rules provide traders with a good idea of where the price is going within the channel, they leave little insight into where breakouts might occur. Identifying patterns known as Wolfe Waves and Gartleys, however, can help predict these breakouts in terms of both their timing and scope (their proportion to the established channel). This article will take an in-depth look at the channelling techniques centered on these patterns and how they can be applied to help you profit.
Wolfe Waves
The Wolfe Wave is a natural pattern found in every market. Its basic shape shows a fight for balance, or...
Short
term trading can be very lucrative, but it can also be risky. A short term
trade can last for as little as a few minutes to as long as several days. To
succeed at this strategy as a trader, you must understand the risks and rewards
of each trade. You must not only know how to spot good short term opportunities
but also how to protect yourself. In this article, we'll examine the basics of
spotting good short term trades and how to profit from them.
The Fundamentals of Short Term Trading
Several basic concepts must be understood and mastered for successful short term trading. These fundamentals can mean the difference between a loss and a profitable trade.
Recognizing Potential Candidates
Recognizing the "right" trade will mean...
Many say that charting is nothing more than predicting the direction of a price between significant support and resistance levels. We know that a support level is a price level which a stock has had difficulty falling below. This is where a lot of buyers tend to enter the stock.
Similarly, we know that resistance is a price level above which a stock has difficulty climbing. This is where a lot of buyers take profits and shorts enter. Typically, a stock's price will range between these levels until it breaks out or breaks down. Hundreds of different methods can be used to locate these areas of support and resistance, but one of the most underrated methods is simply using price by volume, or PBV, charts.
In this article, we explain what...
I was asked the other day about "volatility" by a popular media outlet. The question was: "What should traders and investors do in a volatile market?" I didn't have to think about the answer, I had it before they were halfway done with the question. Simple, if you don't know how to time the market's turning points in advance, don't have money at risk in the market. If you do know how to time the market's turning points, you love market volatility. Recently, the markets have experienced a period of extreme market volatility. During these periods, those who know market timing typically see above average profits and those who don't experience above average losses. No matter what type of trading or investing you are doing, you can't get...
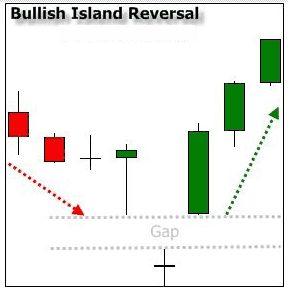
Candlestick patterns provide insight into price action at a glance. While the basic candlestick patterns may provide some insight into what the market is thinking, these simpler patterns often generate false signals because they are so common. Below, we will look at more advanced candlestick patterns that offer a higher degree of reliability. These include the island reversal, hook reversal, three gaps and kicker patterns.
Island Reversal Pattern
Island reversals are strong short-term trend reversal signals. They are identified by a gap between a reversal candlestick and two candles on either side of it. Here is a bullish example. The price is moving down, gaps lower, then gaps up and continues higher.
Here is a bearish example of...
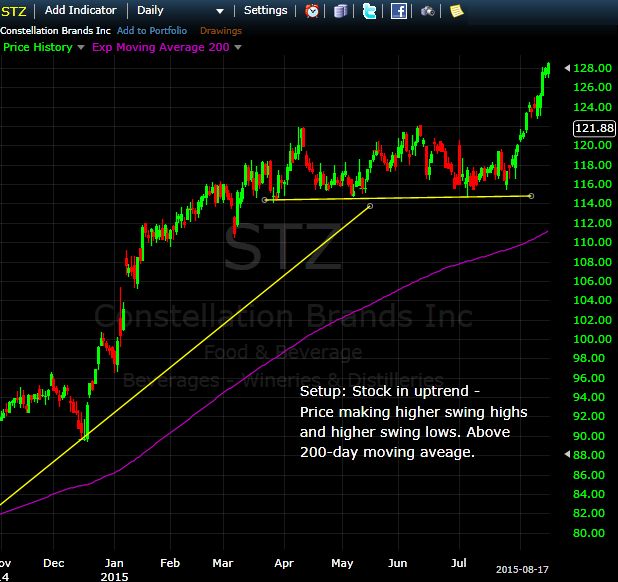
No matter which market you trade – stocks, forex or futures – each second the markets are open provides an opportunity to trade. Yet not every second provides a high-probability trade. In a sea of nearly infinite possibilities, put each trade you consider through a five-step test so you'll only take trades that align with your trading plan and offer good profit potential for the risk being taken. Apply the test whether you're a day trader, swing trader or investor. At first it will take some practice, but once you become familiar with the process, it takes only a few seconds to see if a trade passes the test, telling you whether you should trade or not.
Step 1: The Trade Setup
The setup is the basic conditions that need to be present...
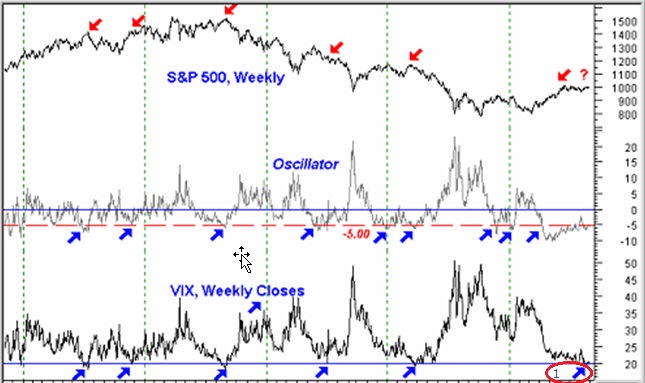
A Google search on VIX yields some unexpected pages: the name of a Czech rock band, a swim wear catalog and the Vienna Internet Exchange. Interesting stuff, but not quite what we had in mind. The CBOE's VIX is a popular market-timing indicator. Let's take a look at how VIX is constructed and how investors can use it to evaluate U.S. equity markets.
What Is the VIX?
VIX is the symbol for the Chicago Board Options Exchange's volatility index. It is a measure of the level of implied volatility, not historical or statistical volatility, of a wide range of options, based on the S&P 500. This indicator is known as the "investor fear gauge," because it reflects investors' best predictions of near-term market volatility , or risk. In general...
Leonardo Pisano, nicknamed Fibonacci, was an Italian mathematician born in Pisa in the year 1170. His father Guglielmo Bonaccio worked at a trading post in Bugia, now called Béjaïa, a Mediterranean port in northeastern Algeria. The young Leonardo studied mathematics in Bugia and during extensive travels, he learned about the advantages of the Hindu-Arabic numeral system. In 1202, after returning to Italy, Fibonacci documented what he had learned in the "Liber Abaci" ("Book of Abacus"). In doing so, he popularized the use of Hindu-Arabic numerals in Europe.
The Fibonacci Number Sequence
In the "Liber Abaci," Fibonacci described the numerical series now named after him. In the Fibonacci sequence of numbers, after 0 and 1, each number is...

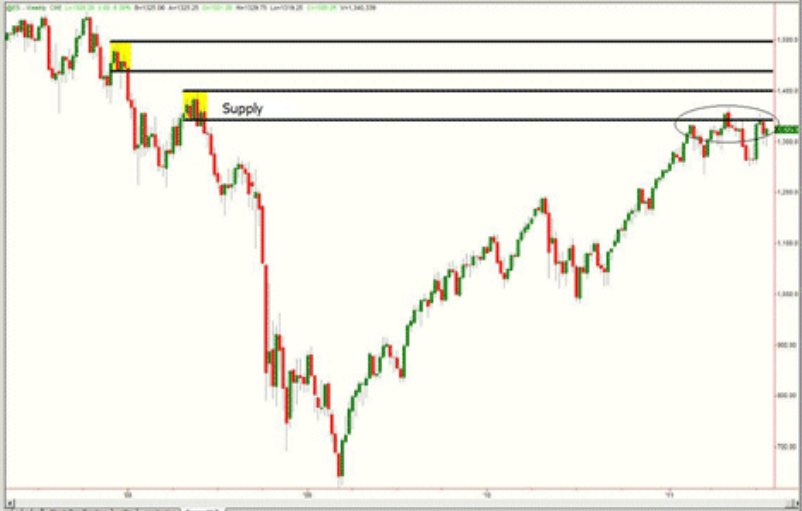
Price Charts: Price charts represent the footprints of money, ie. peoples’ buy and sell decisions. Areas on any price chart where you see lots of trading activity suggests relative equilibrium in supply and demand. Areas on the price chart where you see little activity suggests supply and demand are out of balance; this is where price turns.
Time Frames: You can look at a price chart in any time frame you want these days. The purpose of looking at multiple time frames is the same as why a Doctor takes multiple X-rays when looking at a broken arm, for example. The 2 or 3 X-rays will all look different, but it’s still the same arm. Looking at multiple time frames helps us figure out where the real supply/demand imbalance is in a market...
S&P 500 index futures surged in popularity in the past decade after the SEC’s pattern day trading rule triggered an exodus of retail capital out of equities and into Globex, CME’s 24-hour electronic trading platform. Volume hit a historic peak in 2011, underpinned by a worldwide transition in risk from individual securities to broad macro instruments, driven by an explosion in ultra-modern derivative products. Along with the Nasdaq 100 and Russell 2000 Index futures, the threesome carve reliable road maps for active traders seeking intraday buy and sell signals.Futures trading in the hours between New York’s U.S. equity close and the next morning’s open captures market-moving events in Asian and European bourses. In turn, these...

The idea of volatility makes many traders feel jittery and uncertain. Volatility can make traders:
1) Too frightened to place a trade
2) Panic and close a trade early
The irony is that in times of high volatility, profit targets have the best chance of being hit. Often after being frightened out of a trade, the trader will quote ‘Sod’s law’ (Murphy’s Law in America) when the market turns around and carries on in the originally forecasted direction.
The pattern of volatility
Volatility ebbs and flows in the market. The basic pattern is that the market moves from periods of high volatility to periods of low volatility. Sharp bursts of activity up or down are followed by periods of relative calm. It may be that the trend has...
Indicators, such as moving averages and Bollinger Bands, are mathematically-based technical analysis tools that traders and investors use to analyze the past and predict future price trends and patterns. Where fundamentalists may track economic reports and annual reports, technical traders rely on indicators to help interpret the market. The goal in using indicators is to identify trading opportunities. For example, a moving average crossover often predicts a trend change. In this instance, applying the moving average indicator to a price chart allows traders to identify areas where the trend may change. Figure 1 shows an example of a price chart with a 20-period moving average.
Fig1: QQQQ with a 20-period moving average. Source...
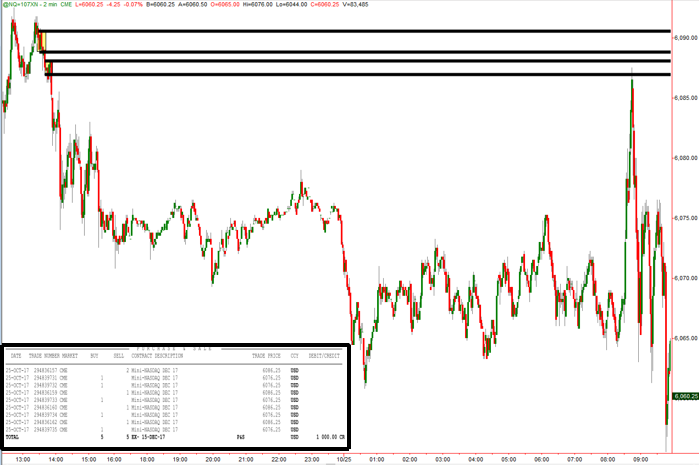
If moving averages are hurting your trading or investing performance and getting you below average results, it’s because that’s exactly what they are designed to do. They are a very popular tool for novice retail traders and investors yet hardly used or thought about by the professional trader/investor. Helping you understand this is the focus of this piece.
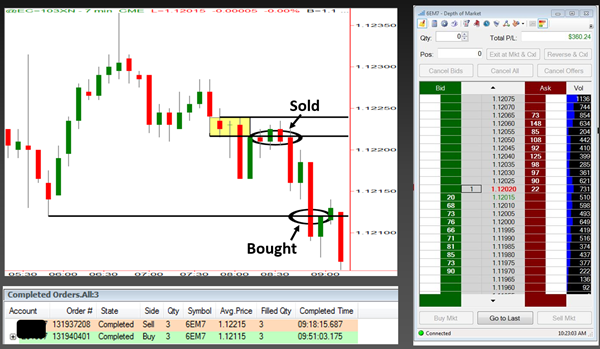
Instead of going through many charts to find the perfect picture to use as an example to illustrate my logic, I like to use real trades as examples from our live trading rooms.
Below is a trade I took in the NASDAQ futures. We identified 2 strong supply zones where banks were selling that morning as seen on the chart below. When price rallied and reached the supply zones, I...
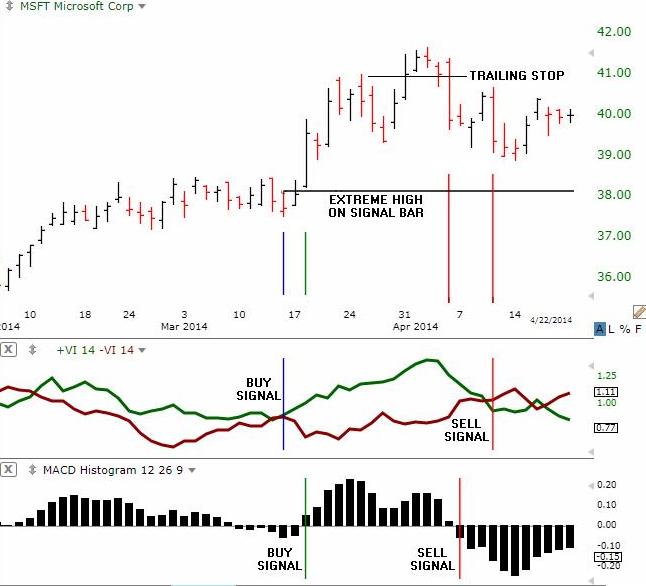
Swiss market technicians Etienne Botes and Douglas Siepman introduced the vortex indicator in the January 2010 issue of the magazine, “Technical Analysis of Stocks and Commodities.” Since then, the new technical indicator has gained traction as a reliable trend following indicator that can produce surprisingly accurate buy and sell signals. However, it will take a few more years of market testing and experience to fully evaluate the vortex indicator’s potential.
What is the Vortex Indicator?
The vortex indicator plots two oscillating lines, one to identify positive trend movement and the other to identify negative price movement. Crosses between the lines trigger buy and sell signals that are designed to capture the most dynamic...
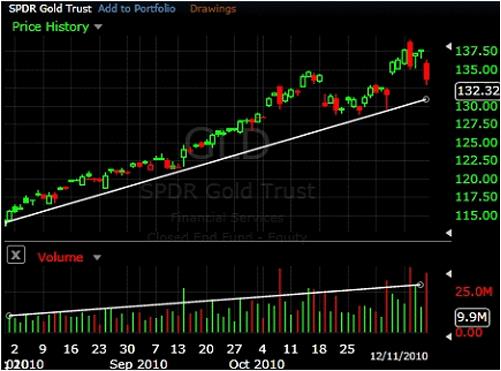
Volume is a measure of how much of a given financial asset has been traded in a given period of time. It is a very powerful tool but is often overlooked because it is such a simple indicator. Volume information can be found just about anywhere, but few traders or investors know how to use this information to increase their profits and minimize risk.
For every buyer, there needs to be someone who sold them the shares they bought, just as there must be a buyer in order for a seller to get rid of his or her shares. This battle between buyers and sellers for the best price in all different time frames creates movement while longer-term technical and fundamental factors play out. Using volume to analyze stocks (or any financial asset) can...
William Delbert Gann is perhaps the most mysterious of all the famous traders in history. Known for using geometry, astrology and ancient mathematics to predict events in the financial markets and even historical events, Gann's trading strategies are still widely used today, 62 years after his death in 1955. Gann disciples claim he was one of the most successful stock and commodity traders who ever lived, while critics argue there's no concrete proof that he ever made a great fortune from speculation. Was Gann really a great trader, or was he merely a ‘guru’ who profited from selling books and running seminars?
Early Life
W.D. Gann was born in 1878 in Lufkin, Texas, the first of 11 children in an impoverished cotton farming family. He...
To engage in momentum trading, you must have the mental focus to remain steadfast when things are going your way and to wait when targets are yet to be reached. Momentum trading requires a massive display of discipline, a rare personality attribute that makes short-term momentum trading one of the more difficult means of making a profit. Let's look at a few techniques that can aid in establishing a personal system for success in momentum trading.
Techniques for Entry
The impulse system, a system designed by Dr. Alexander Elder for identifying appropriate entry points for trading on momentum, uses one indicator to measure market inertia and another to measure market momentum. To identify market inertia, you can use an exponential moving...
I have always found it very interesting, how many different ways people look at charts and all the different pieces of information people try to attain from a price chart. How could so many people look at the same chart and have so many different opinions? Fascinating.
With all the different schools of thought on money, markets, charts and so on, what should we really be looking for on a price chart? I mean, conventional technical analysis books have hundreds of pages in them with information on so many indicators, oscillators, chart patterns and more. With all this, there must be some edge to be gathered, right? I speak with thousands of traders around the world and everyone is trying to make something “work”. This is where I see most...