You are using an out of date browser. It may not display this or other websites correctly.
You should upgrade or use an alternative browser.
You should upgrade or use an alternative browser.
Articles
The most important financial center in the world? A fabled place of silver spoons and golden parachutes? A hub of cut-throat capitalism? Or all of the above. Wall Street is many things to many people, and the perception of what it really is depends on who you ask. Although people’s views of Wall Street may differ widely, what is beyond dispute is its enduring impact not just on the American economy, but on the global one.
What Is Wall Street Anyway?
Wall Street physically takes up only a few blocks that amount to less than a mile in the borough of Manhattan in New York City; however, its clout extends worldwide. The term “Wall Street” was initially used to refer to the select group of large independent brokerage firms that dominated...
You've probably heard the terms spread or bid and ask spread before, but you may not know what they mean or how they relate to the stock market. The bid-ask spread can affect the price at which a purchase or sale is made - and an investor's overall portfolio return. What this means is that if you want to dabble in the equities markets, you need to become familiar with this concept.
Supply and Demand
Investors must first understand the concept of supply and demand before learning the ins and outs of the spread. Supply refers to the volume or abundance of a particular item in the marketplace, such as the supply of stock for sale. Demand refers to an individual's willingness to pay a particular price for an item or stock.
Example - How...
If ever there was a rock star of economics, it would be John Maynard Keynes. He was born in 1883, the year communism's godfather Karl Marx died. With this auspicious sign, Keynes seemed to be destined to become a powerful free market force when the world was facing a serious choice between communism or capitalism. Instead, he offered a third way, which turned the world of economics upside down. In this article, we'll examine Keynes' doctrine and its impact.
The Cambridge Seer
Keynes grew up in a privileged home in England. He was the son of a Cambridge economics professor and studied math at university. After two years in the civil service, Keynes joined the staff at Cambridge in 1909. He was never formally trained in economics, but...
Most of us have wondered whether a decline in the price of a stock we're holding is long-term or a mere market hiccup. Some of us have sold our stock in such a situation, only to see it rise to new highs just days later. This is a frustrating and all too common scenario. Whilst it can't be totally avoided, if you know how to identify and trade retracements properly, you will start to see improvement in your performance.
Retracements Versus Reversals
Retracements are temporary price reversals that take place within a larger trend. The key here is that these price reversals are temporary and do not indicate a change in the larger trend. A reversal, on the other hand, is when the trend changes direction, meaning that the price is likely...
It is rare to hear any long discussion of the stock market without some mention being made of the economic outlook. As of Summer 2018, it's safe to say that the economy has recovered to a certain extent from the recession of 2008. What analysts are now wondering about is if the current good fortune is sustainable or if there's another crash around the corner.
Given that the economists on business TV seem to live to disagree, what should a regular investor do? Just what should an economic recovery look like? Follow these economic indicators for signs of a recovery.
Employment
It is difficult to talk about an economy in recovery if people are not getting back to work. There are such things as "jobless recoveries", where there is enough...
As we all know, the stock market has been in a bull run for a very long time. By the time you read this, it will be the longest bull market on record.
In the nine and a half years since the final down month of the previous bear market (February 2009), the S&P 500 Index has increased by almost 300%. That makes it an average compounded annual growth rate of over 15%. Add in an annual dividend yield of around 2%, and the past decade has been a very good time for stock investors.
The current environment seems favorable to a continued boom in the stock market. Corporate earnings are at record highs and GDP growth is strong; while unemployment and inflation are both very low. It’s a Goldilocks economy again – not too hot, not too cold, just...
When it comes to investing, there is no shortage of theories on what makes the markets tick or what a particular market move means. The two largest factions on Wall Street are split along theoretical lines into adherents to an efficient market theory and those who believe the market can be beat. Although this is a fundamental split, many other theories attempt to explain and influence the market - and the actions of investors in the markets. In this article, we will look at some common (and uncommon) financial theories.
Efficient Market Hypothesis
Very few people are neutral on efficient market hypothesis (EMH). You either believe in it and adhere to passive, broad market investing strategies, or you detest it and focus on picking...
Everywhere I turn these days, I see articles discussing how over-extended U.S. equity valuations have become. If I took a shot of mouthwash every time I came across an article that talked about U.S. equity valuations, I’d be leaving Las Vegas, Nic Cage-style, minus Elisabeth Shue. I monkey-hammered the idea of valuation as a catalyst for an equity market drawdown several weeks ago, but this week it’s woodshed time for Mr John Hussman.
Hussman has a brand new commentary beating the same dead “S&P 500 is overvalued” horse, but this time he’s coined a new phrase to describe the S&P 500: “offensively overvalued.”
While I obviously can’t say for certain what this guy uses to make investment decisions, it’s not a stretch to assume that...
Can the market predict a recession? A “yes” answer might seem tautological on the surface, but isn’t. A recession is technically a reduction in economic activity, rather than in stock prices. Rephrasing the question a little, is it possible to have, whether in the long term or the short, an environment of low stock prices and high real income (along with high industrial production and employment)? To the first part, certainly not if the population at large is relying on stock appreciation for its remuneration. But given that wages and salaries still make up the bulk of most people’s personal income, a bear market shouldn’t affect said income by all that much.
Information, Not Opinions
The data isn’t hard to plot. Sustained reduction of...
Imagine you had invested $10,000 at the bottom in 2008. The results you find below might not blow you away on an actual basis, but the amount invested is all relative based on your financial situation. It’s the percentage gain that’s more important because that number is going to be the same for everyone – assuming investors poured money into the market at the exact same time for this hypothetical situation. In addition to looking at how much money you would have made, we’ll also take a brief look to see if the same kind of return is possible over the next eight years.
S&P 500
The S&P 500 consists of approximately 500 large-cap stocks (it’s never exactly 500 stocks these days and tends to change) that are either listed on the NYSE or...
The use of the fundamental approach in trading has long been an object of argument between its followers and those who mercilessly deride the method's usefulness. We will not take sides in this eternal argument, but we will try to find out how the average trader can benefit from fundamental analysis. Read on to discover the strengths and weaknesses of fundamental analysis as a traders' tool.
The Mechanics
The fundamental approach is based on an in-depth and all-around study of the underlying forces of the economy, conducted to provide data that can be used to forecast future prices and market developments. Fundamental analysis can be composed of many different aspects: the analysis of the economy as the whole, the analysis of an...
Calculating investment performance is one of the first things finance students must learn in business school. Along with risk, return is a fundamental concept that is clearly important when dealing with wealth and how to grow it over time. The compound annual growth rate, or CAGR for short, represents one of the most accurate ways to calculate and determine returns for individual assets, investment portfolios and anything that can rise or fall in value over time.
The CAGR represents the year-over-year growth rate of an investment over a specified time period. And as the name implies, it uses compounding to determine the return on the investment, which we will see below is a more accurate measure when those returns are more volatile...
The bailout of Greece's economy and the subsequent action to restore Cyprus' economy were the big Euro-stories of the last three years. A year on from the Cyprus crisis and a few weeks after the Greek government returned to the private capital markets, all seems to be quiet but is this the lull between storms?
The stories of the fall of both countries' economies has many similarities yet many differences but neither country is out of the woods yet. In this article we examine the causes of the collapse and what the future holds for each.
Behind the terrible state of the Greek economy which first came to light late in 2009 and into 2010 was the systematic fabrication of economic statistics which hid a growing fiscal deficit which was...
In 2008 I wrote an article for T2W entitled: Housing Boom – is the party over? in which I categorically stated that I expected house prices to fall substantially and that investors should look to invest in the stock market from 2008 onwards. I was right on both counts. House prices in some areas have dropped as much as 25%, while the average stock market index has nearly doubled.
After a decade long boom due to lower interest rates and easy lending, the party finally came to a sticky end for U.K. property prices in 2009. According to Land Registry, property prices in the U.K. rose by an astronomical 200% in a decade.
Five years on, I find it difficult to make a case for increases in house prices in the U.K. based on numerous factors...
With the final approval of Germany's supreme court in hand, Germany can now legally join the latest eurozone bailout attempt in the hopes of offering more time and more stability to an area still roiling with the fallout of sovereign debt crises in multiple states. While the citizens and governments of many other European countries would no doubt deeply resent the idea of the European Stability Mechanism (ESM) as a "German bailout," make no mistake - without Germany's ongoing participation and financing, there would be serious turmoil in European financial markets.
In for a Pfennig, in for 190 Billion Euros
With the approval of Germany's supreme court in mid-September, the ESM can now move forward as the latest effort to stem the...
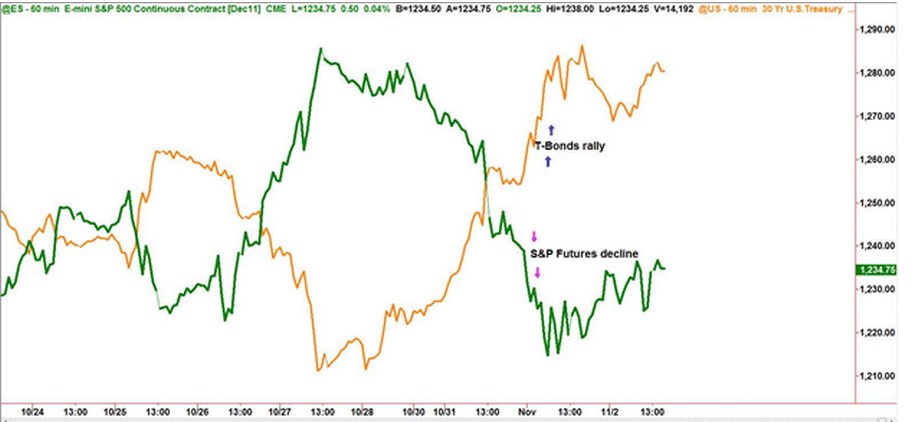
One asset category that is not very well understood is what we refer to in the business as the credit markets. In the futures market, these encompass all debt instruments such as U.S. Treasury Bills, Notes, and Bonds, and are not limited to derivatives of debt issued by the U.S. treasury. The German debt market can also be traded here through most futures brokers on the Eurex exchange. These derivative instruments come with funny names like Schatz, Boble, and Buxl, and finally, the Bund. The different names in all debt instruments are there simply to differentiate the short, medium, and long term maturity dates.
These particular European markets are nice to know about, but for those of us in the U.S., they're not as important as say...
China was never at the heart of the global financial crisis, yet in the past two
years worries over China's economic future have not been relieved. The media
warned China a year ago about its massive overcapacity and an impending
economic collapse.
Today the case is just the opposite and the international community is more
concerned about China's overheated economy. China's moves to raise overall
wages and to introduce an exchange rate regime reform have topped the
headlines recently. Although China of course faces challenges ahead, we do
not think there is much cause for concern.
China has successfully weathered the global financial crisis, thanks to the
governments massive stimulus plan and the central banks huge liquidity...

Part of the learning process is for you to understand the different types of traders. In essence there are two, and these are a fundamental trader or a technical trader. For you to succeed as an online trader you must understand the differences. Both have very different views in the techniques they use to assess market conditions and the direction an instrument may take.
Whilst there is some overlap, these are two very distinct methodologies, and you need to be comfortable with one or the other. You will come across this terminology all the time. Whilst there are huge differences in the approach, it is safe to say that most large financial institutions now employ both methods as both have their strengths and weaknesses. Fundamental...
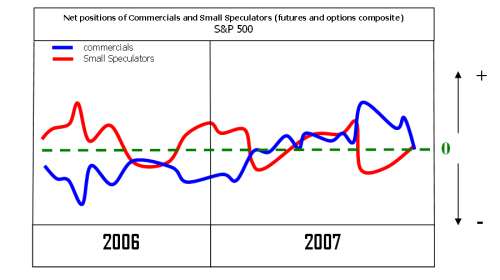
The end of 2007 was characterized by extreme values in various indicators of stock market analysis. In this article I will review and analyze four of them. I will use the term "indicator" here not necessarily according to the technical analysis jargon but rather as a set of clues (either measurable or not) under the same idea which can reveal specific internals of the stock market and imply bullish or bearish projections.
The First Indicator: Commercials Versus Small Speculators
The Commodity Futures Trading Commission releases weekly information known as Commitment of Traders (or simply COT) report about various markets which can be used to approximate the net open interest for futures and options in each of the following three...
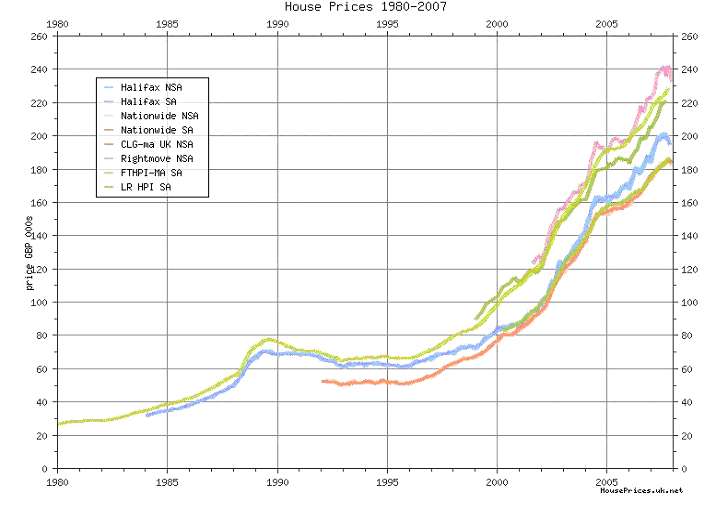
Recently the IMF said that the UK's property was overvalued and this could result in a spectacular slump. House prices in the US have slowed down considerably since 2005.
The UK avoided the Recession in 2001 when many countries went into deep recession. Post 9/11 the UK interest rates were at the lowest for many decades, this resulted in a boom in the UK housing market as the cost of mortgages was at its lowest. The low cost of borrowing also saw a boom in the buy to let market with many investors having a big portfolio of properties.
Not only was the UK government on a spending spree but also the UK consumer, due to the easy availability of credit. Currently the UK personal debt level has exceeded more than £1 trillion. It is...
Newton's Third Law of Motion states that
"for every action, there is an equal and opposite reaction."
Such 'action' can be by direct contact, such as from friction, tension or applied forces. Then you have such 'actions' as a result of gravity, electrical and magnetic.
Forces come in pairs. For every action, there is opposite reaction. The size of the reaction is equal to the size of the action. Nature is filled with such evidences of this law. For example, when a bird flies it uses its wings to push air downwards. As a result, the air reacts by pushing the bird upwards. The size of the force on the air equals the size of the force on the bird. The direction of the force on the air is opposite the direction of the force on the bird...
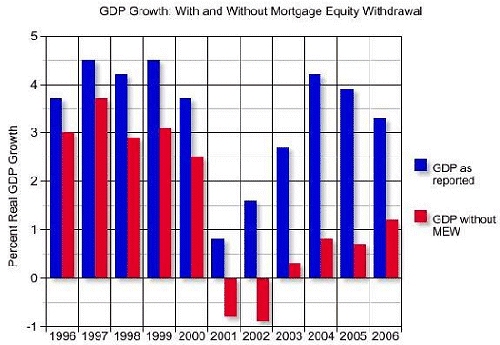
How has another year come and gone so quickly? It seems like someone hit the fast forward button. And once again, all too soon, it is time for me to demonstrate my masochistic nature and write a forecast issue. Rather than going into details on every topic, I will try and stick to the big picture and leave the fine points for later letters.
Each year as I do this forecast, I look for a theme. What will be the driving factor which will set the stage for the economy? In 2001 it was the coming recession; in 2002 it was a weak recovery and the beginning of the Muddle Through Economy; in 2003 it was Surprise and Transition. In 2004 it was the Silver Lining Economy; in 2005 it was the See-Saw Economy. Last year it was The Gripping Hand, as...
What effect does conflict and war have on the stockmarket? In this article we look at past wars/conflicts and examine what the future might be with the current conflict in the Middle East.
Maybe I should stop taking my two-week Nantucket trip each summer. Last year during our stay we were glued to the news over the London terrorist bombing, and this year it was Hezbollah's kidnapping of two Israeli soldiers, prompting the current fighting in the Middle East.
There's a thought on Wall Street that investors should be
"buying when the cannons sound and selling when the trumpets sound."
When thinking about this view I harkened back to mid-March of 2003, when on the eve of the current Iraq war, Schwab's Investment Strategy Council (which I...
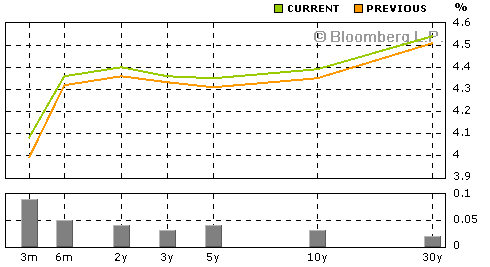
A look at the yield curve and why it is said to be the most accurate forecast of looming recession.
I have written about the yield curve more than any other single topic in the almost six years of writing. There is a justifiable reason to pay attention to the yield curve. In certain very specific circumstances, it has been the single most reliable predictor of recessions. Let's examine what those circumstances are.
First, the yield curve is a graphic depiction of the relationship between the yield on bonds of the same credit quality but different maturities. Normally, you expect to get more interest paid to you for holding a longer maturity, as in theory there is more risk to holding a bond for ten years than for 90 days, or for 30...

Open interest is without a doubt the least used bit of market data by chart watchers. Conventional wisdom; prices up on increasing O.I. being bullish, is just as often found to be bearish.
What I want to show here is the relationship of O.I. and the buying patterns of the Commercials for the Commitment of Traders (COT) report.
I'll begin by showing a chart of gold with an indicator I'm sure you have never seen before, a 13 week stochastics of just Open Interest. Yes, this index is simply an oscillator of O.I. What we see is that, generally speaking, low levels in this index are found at market bottoms.
Thinking about it makes sense as what it is telling us is there is little interest, open or not, in the market we are studying. I...
The current account (CA) represents the sum of goods and services balances, income, and unilateral transfers
Studies show that industrialized countries running a current account deficit in excess of 5% of GDP will undergo exchange rate and/or price adjustment; currently the US CA deficit is hovering 6%.
In light of the market's overall focus on the sizable US current account deficit, the following note defines and explains the balance and its components.
What is the current account?
The current account measures a country's international transactions, and includes four main components:
Goods: Physical objects whose ownership is transferred across borders. Goods include both general merchandise (retail goods) and capital goods (i.e...
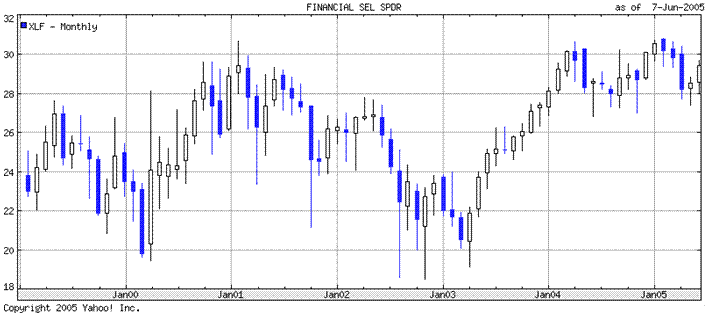
It is appreciated that Trade2Win is first and foremost a "technical analysis" site. Those that know of me from T2W may be aware that my methodology is one of "fundamental analysis". From this rather black and white perspective, what do I have to offer the committed technical analyst? I offer you the
price/earnings ratio.
The P/E ratio, as it is more commonly referred to, lends itself well to the non-financial analyst for a number of reasons. I shall suggest a methodology that is hybrid in nature, combining the P/E ratio (exclusive of any knowledge, or reference to, the financial statements) with a technical chart that acts as a filter for the P/E ratio, imbuing the P/E's calculation with a factor of safety. We shall end up with a...
Most traders tend to use technical analysis to pick their entry and exit points when trading, and swear by those methods, but if it were really that good why are there so many variations? More importantly, why do so many technical traders lose money? The answer is quite simply that they are using charts to predict the probable future price movement, based on patterns. Now that is okay but it is only slightly different from a gambler who might say that, based on the fact that there are 36 number cards and 16 face cards (excluding the 10s), there is a 9/13 chance of drawing a numerical card and as such he will place his money on that.
Now that is acceptable if one were to view the accumulation of wealth as a gamble, but for the serious...
