You are using an out of date browser. It may not display this or other websites correctly.
You should upgrade or use an alternative browser.
You should upgrade or use an alternative browser.
Articles
Successful investors and traders alike usually have a rule-based strategy that provides them with a financial advantage or edge. A combination of institutional supply and demand, fundamental and technical analysis are typical components. Another analysis we can add to the recipe is investor mood, commonly called sentiment. In other words, do market participants feel bullish, bearish or neutral about the future?
While each region and country has a unique economy, given the volume of international trade, those individual economies are part of a larger global economy. The U.S. economy is the largest in the world but, more importantly for this analysis, it is also the last market traded on the daily clock. This allows U.S. investors a...
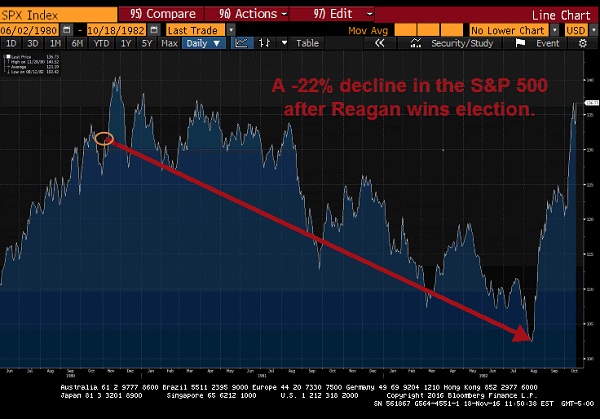
The latest bullish meme floating around Wall Street is that President Donald Trump is going to unleash a new era of big fiscal spending. As a result, lackluster U.S. economic growth is going to finally accelerate to the upside. Inflation is going to pick up. In a nutshell, this is the narrative which has triggered a huge rip higher in the U.S. stock market.
Be careful accepting that bullish narrative as gospel.
Take a look at history – it offers investors some interesting perspective. In particular, the post-election market between 1980 and 1982. On November 4, 1980, Ronald Reagan was elected president. The country appeared to be riding high.
What happened?
The stock market rallied – big. In fact, the S&P 500 jumped 7% from the...
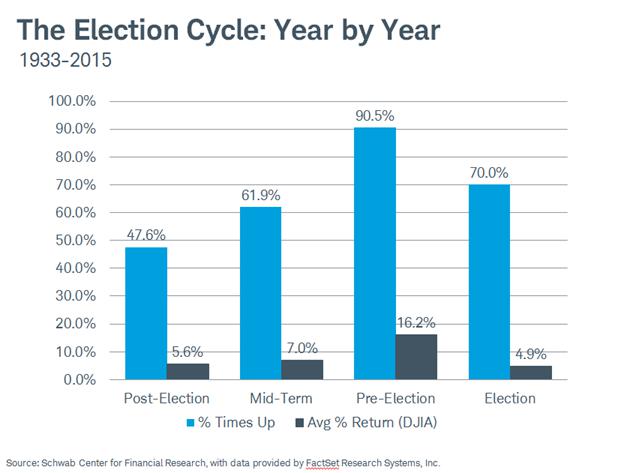
In November of 2016 Americans will choose a new president. A detailed study of history can give us some interesting clues on how the USstock market might behave regardless of who wins.
Many market analysts have noted a general tendency for the stock market to experience a meaningful price bottom roughly every four years. Of course, the exact timing from low to low does not always correspond to an exact four year cycle. Still, there does appear to be some correlation between the action of the stock market and the four year period that extends from one presidential election to the next. This is most commonly referred to as the “Election Cycle.”
The Election Cycle
The “Election Cycle” as generally defined, consists of the...
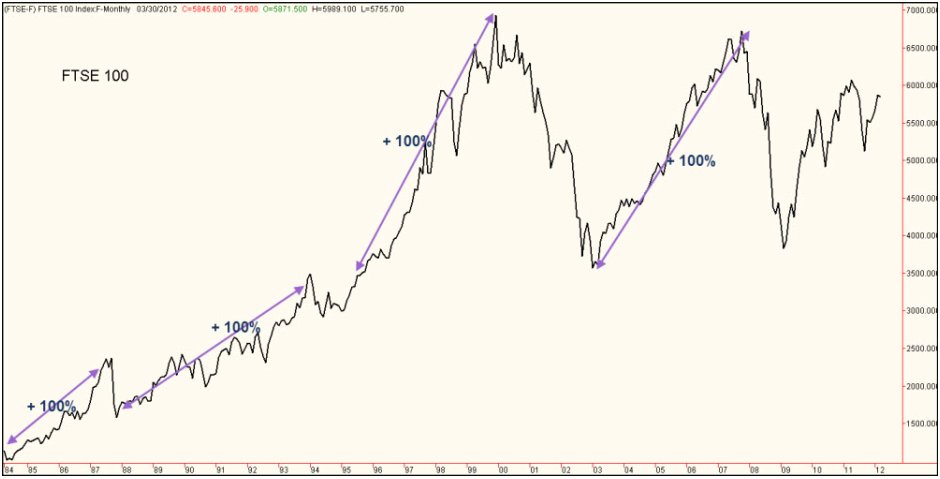
So, an analyst at Citigroup reckons that the FTSE 100 should double in value over the next 10 years. Actually, were that to happen (but see below) it would be no big deal as the FTSE has doubled in value no less than 4 times since its launch in April 1984 and, each time, it has taken far less than 10 years to do it –
April 1984 @ 1150 - doubled to 2300 by May 1987 = 3 years
Oct 1987 @ 1580 - doubled to 3160 by Sept 1993 = 6 years
June 1994 @ 2900 - doubled to 5800 by Feb 1998 = 3.75 years
March 2003 @ 3500 - doubled to 7000 by Oct 2007 = 4.5 years
So, on the face of it, the idea that it might double over the next 10 years is no great shakes; history of the FTSE shows that it could do it in the next 3 to 5 years, tops! But - and...
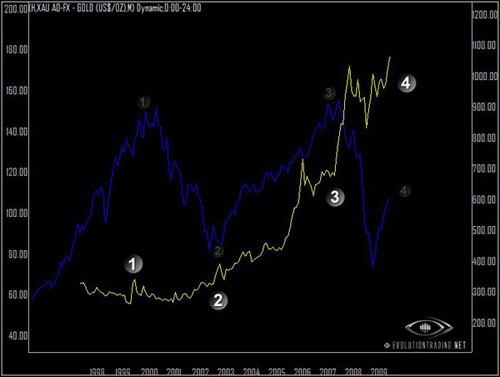
Over the coming week, the legion of earnings announcements will hit the market and will continue over the next few weeks. Being in the seasonally most volatile period of the year and hand in hand with some very interesting technical developments recently, we look to this period to bring in precious volatility and exciting price action.
The big event over the last several days in the financial markets is a fresh, multi-year breakout in Gold to new, All Time High. In our June 28th Newsletter as well as some recent discussions in the Evolution Trading Studio, we pointed out some Bullish price behavior and that the Gold market was beginning to "heat-up." It is gratifying to see the price follow through on our expectations, and the time has...
First, it was Citigroup disappointing with their earnings shortfall, and this, along with less-than-stellar retail sales numbers for December, sent stocks roiling on Tuesday. The Dow and S&P finished the day lower by more than 2%. To add insult to injury, Intel's lackluster earnings release after hours pummeled those shares, setting in motion a plunge in the stock index futures. Translation - the market's in for more selling (at least in the early part of the year).
Can things possibly get any worse? Yes, they can. People seem to possess very short memories. After all, it's only been 4 years since we suffered through one of the worst Bear markets (caused by the technology-led recession) in history. How bad did things get then? From the...
Most commodity futures markets will tip their hand when it's time to reverse direction. Knowing how to read its language is the challenge. It's not easy. This is important information, since this is all you really need to know! Volatility is a clue as well as price synchronization. Read on about these unique observations. This information can be applied to most any freely traded market of any time frame.
Observation Trading Notes:
Keep watching the five minute futures chart with the horizontal line tool to see price support and resistance. Then confirm this action on the one-minute charts.
We have all seen the stair step action of a trending commodity futures market. Sometimes you can keep buying those corrective spike dips into the...
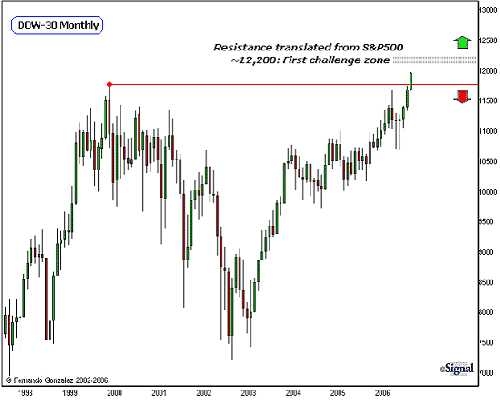
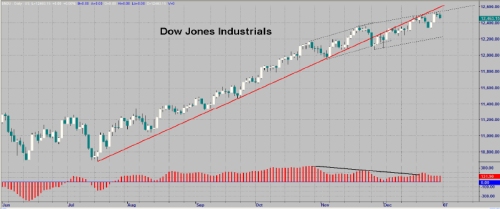
With the Dow making new highs last week, we are now well and truly into unchartered territory. So how should you define the new targets?
The action over the last week satisfies an expectation we have had for the year 2006: a fresh all-time high. The move into new-high territory was not an easy breakout. In May, the DOW crept to within 90 points of an all-time high and thereafter sold-off to lose 8% of its value throughout the next couple of months - this was one of the strongest pullbacks the market had since the major low in 2002. In July, the market found its footing and once again made a second run for its all-time high. It has been all-up ever since and into today. Here's a toast to the Bulls for a well earned victory! Now it's...
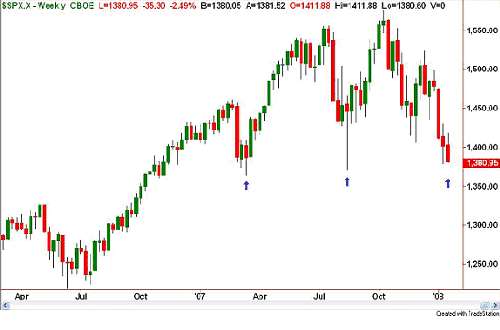
In my view, we are still in a secular bear market and currently at a point of extremely high risk. We have now passed the period of seasonal strength for the year - a time when spirits are high and the market performs better than at any other time on a historic basis. A study in the December 2002 issue of the American Economic Review reported that the average stock market returns from Halloween through May Day (the so-called "winter months") were significantly higher than equity returns from May Day through Halloween (the "summer months"). The findings were that the summer months' returns have averaged so much less than those of the winter months that almost all of the stock market's long-term returns have been produced during the...
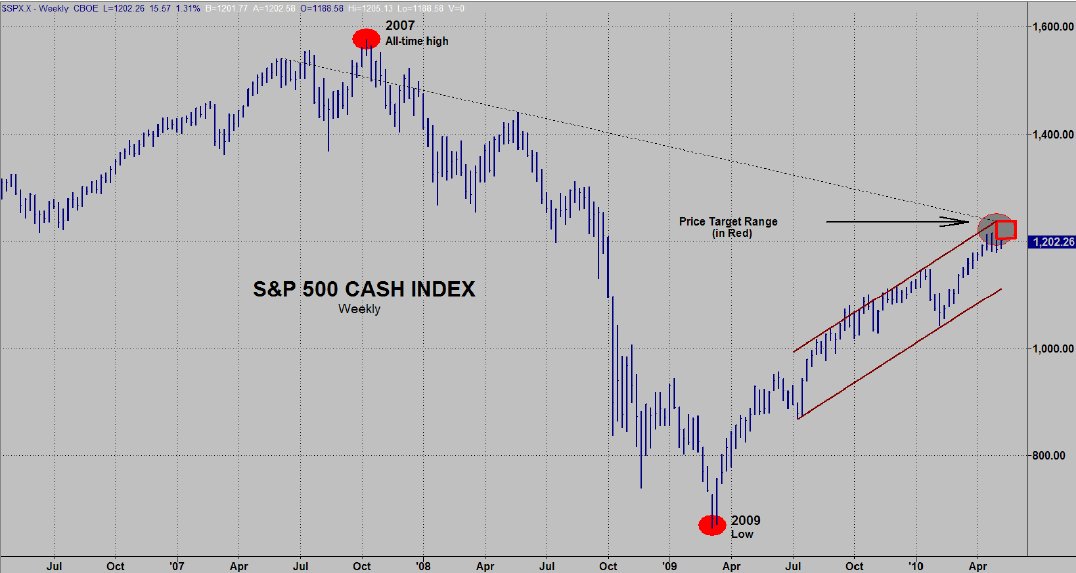
Since my last Special Alert which was written at the start of May with the theme of SELL IN MAY AND GO AWAY, I have had a lot of calls and e-mails asking if I had written another since. I had not because I saw no reason to veer from the message in the prior Alert. The early May Alert was probably the most technical Alert I have written and I concentrated on the monthly charts. That is not something I usually do. Typically, I only refer to a monthly chart when I think that "bigger picture" viewpoint is seriously worthwhile. My focus was almost exclusively on the monthly charts because I believe the April 26th high was the orthodox top for the recent "reprieve rally" that began with the March 2009 low. When I went over my monthly charts...
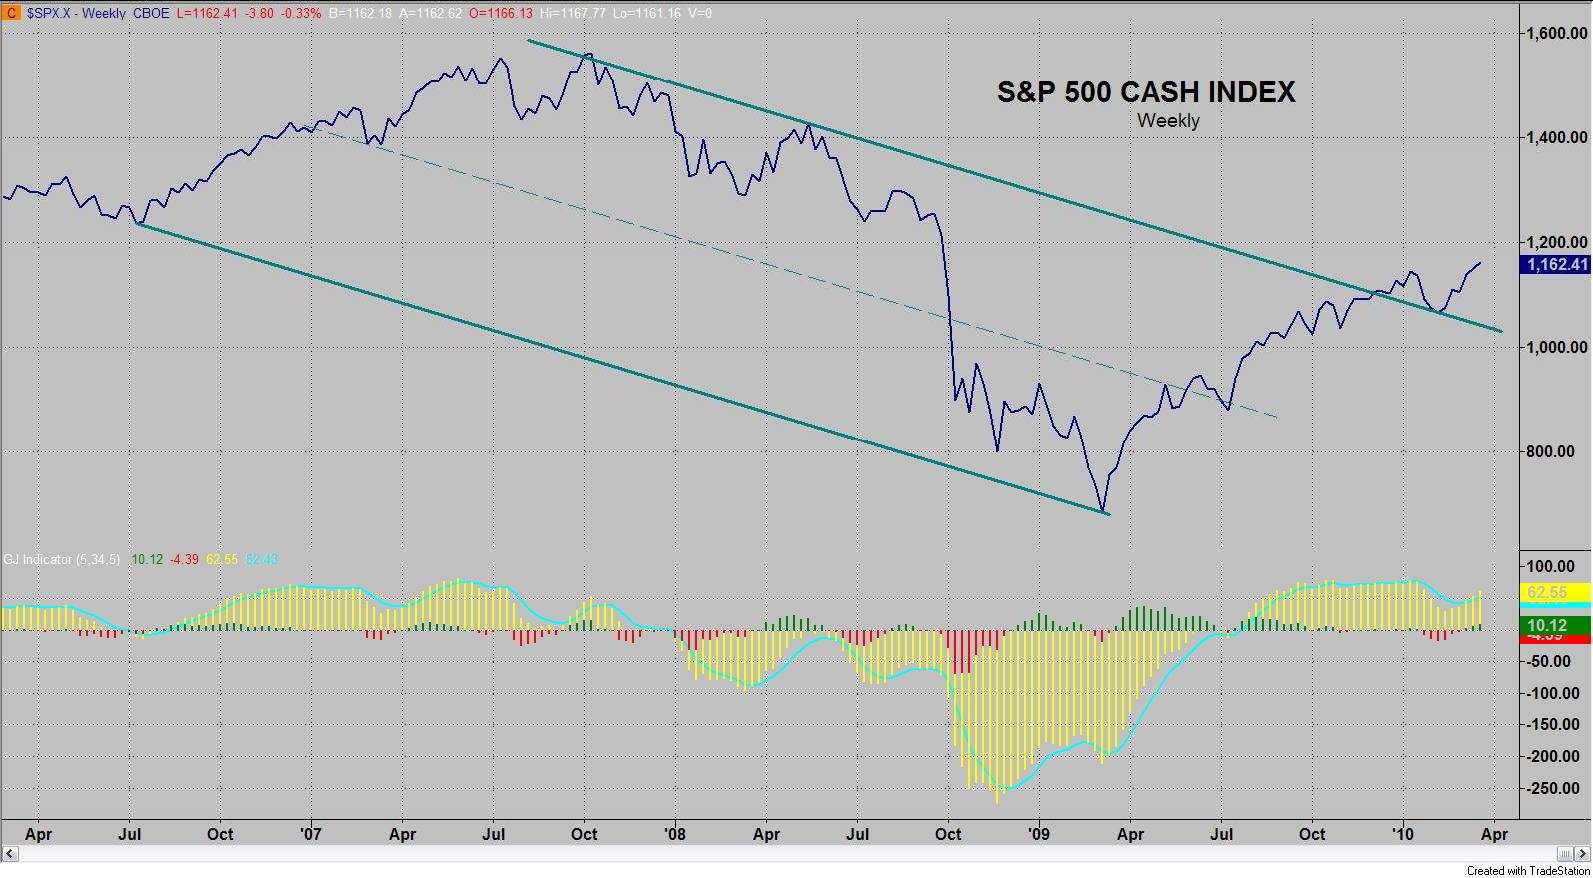
In my view, we are still in a secular bear market and at a point of high risk. However, we are now in the seasonally strong time for the year - a time when spirits are high and the market performs better than at any other time on a historic basis. A study in the December 2002 issue of the American Economic Review reported that the average stock market returns from Halloween through May Day (the so-called "winter" months) were significantly higher than equity returns from May Day through Halloween (the "summer months"). The findings were that the summer months' returns have averaged so much less than those of the winter months that almost all of the stock market's long-term returns have been produced during the winter months. The obvious...
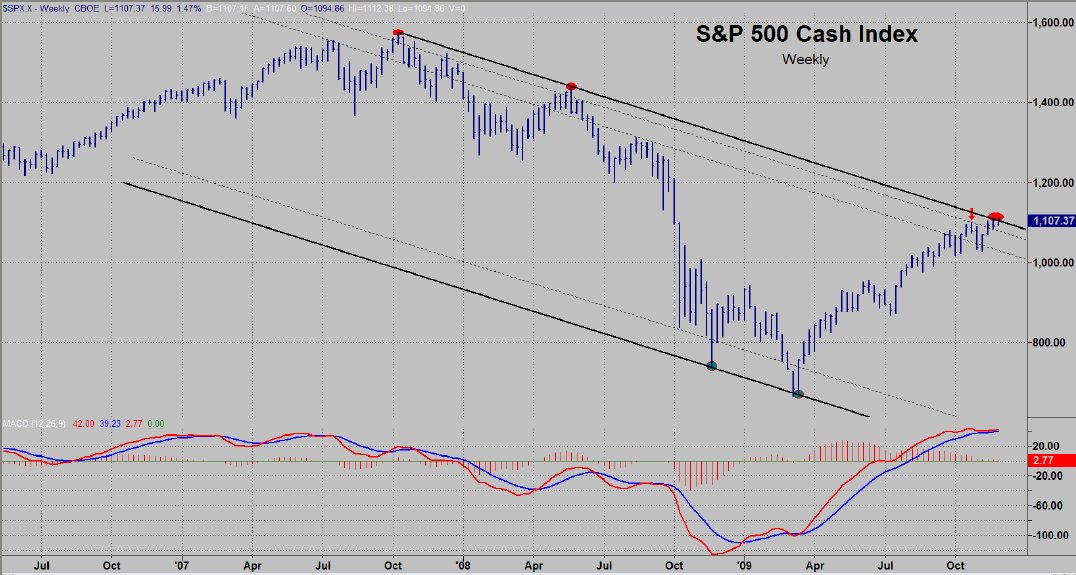
The danger signal has been on my Alerts since August 6th and some people have asked for me to explain why since the market has been going up since that time. First of all, my objective in writing these is not to be a short term trading service, it is to provide you with a big picture look of where we are in the overall cycle and what that is likely to imply. That is why I frequently refer to "the sequence of events in the cycle". Let's go over that for a moment. If I was talking about seasons and began advising my readers to prepare for a hot summer, everyone would wonder whether I had lost my mind because we are in November and the proper comments would have to do with winter, not summer. Everyone knows "the sequence of events" in the...
I began putting the DANGER signal on my Special Alerts to "alert" everyone to Danger (duh). I know this stage of the market well as I have seen it time and time again in many different markets. As I said over and over, "the job of this rally is to draw in as many players as possible" (and then give them a thorough drubbing for being so foolish). There were two "turning points" to potential tops (August 7 and mid September). Both were tops, but only temporarily (very temporarily).
MARKET TOP - (The title of this article), I can't get much more "up front" than that it means that everything I was looking for to produce a market top had occurred and that anything beyond that would send me back to the drawing board. I now think the odds are...
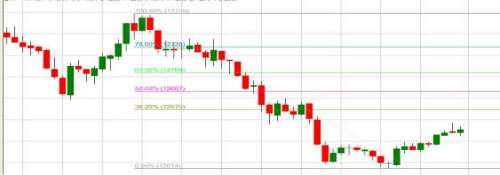
Fibonacci Retracements - A Precision Trading Strategy
Deciding on a topic for this article, I reviewed the top ranked articles in T2W and found some fantastic material. I did not however find inspiration for a new article idea that readers may like. Perhaps strangely, I then looked at the lowest rated articles. I noticed that two of them discussed Fibonacci which both surprised and intrigued me. It was not necessarily that people did not like Fib, just that perhaps it had not been explained well enough for their liking. I am a huge Fibonacci fan and it plays a big part in my trading so the following will explain how I use it to trade successfully.
While this strategy can be applied to almost any market, I will focus on the Dow Jones...
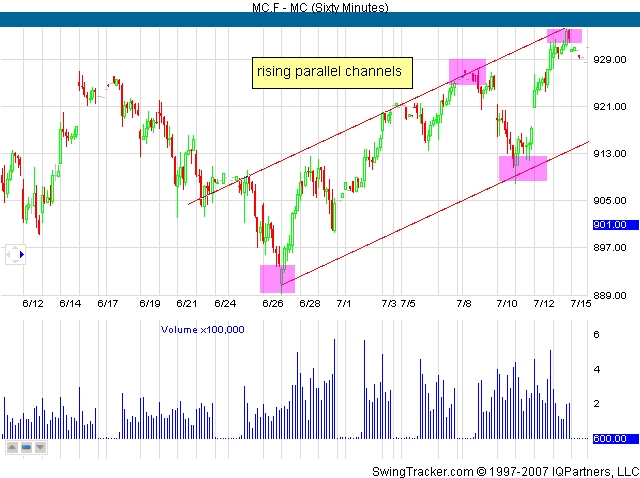
Parallel channels are one of the most commonly seen patterns in charts. They give many opportunities to profit whether or not the market is trending. Horizontal channels are better known as trading ranges when the market is not trending; rising channels occur when market is trending up and falling channels appear when the market is trending down. Regardless of the market conditions seen, parallel channels can be found in all shapes and sizes.
Trade Recap
During the weeks in mid-June to early July, 2007, S&P 400 MidCap E-mini future has been moving up steadily inside a rising channel, as seen on the 60-minute chart below. Although the MidCap has been moving near the all time high, it has been trading in a large trading range. This...
"We begin with a clean slate"
There is something refreshing about the first day of a New Year - for a brief period of time, it feels like a clean slate where we have the opportunity to begin anew and possibly right the wrongs of the year that just ended. Let's all hold that thought and see if we can "will" some good things for 2007. It would appear that the machine that runs our country can use all the help it can get.
As bad as the news was on occasion last year, the market put in a good showing. The following performance for the major indices is worth viewing:
The stock market did well in 2006. It was robust into the spring; had a sharp decline into the summer and then came on strong the rest of the year. The blue chips were the...
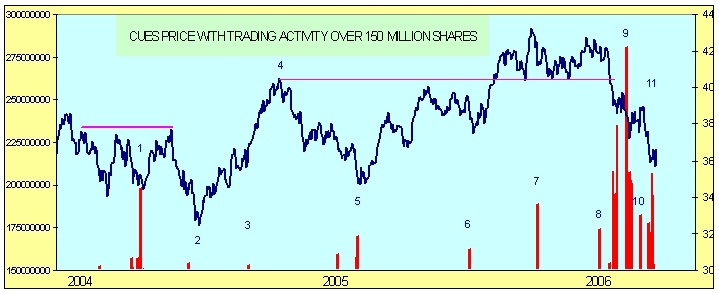
In this article we look at the current market correction with an eye on price and volume and observe how this has marked changes in market sentiment in the past.
The financial papers do not have a problem creating plausible stories that attempt to explain the recent market downturn. Although many fundamental factors have contributed to this recent blowout, as technicians, we take a completely different perspective. Besides looking for clues that might give us insight into the causes of this correction, we are looking for symptoms of a reliable recovery as well.
In the past 37 trading days, the cues (NASDAQ-100: QQQQ) went from an intraday trading high of $40 to a $36.62 close on 7/25/06. Most technicians will automatically inspect...
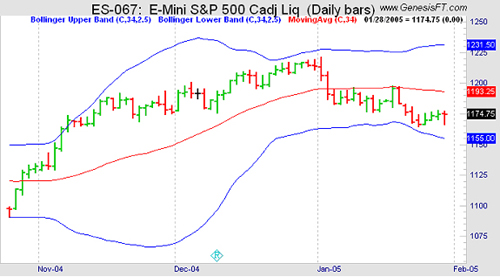
In this article we present a simple trading system that we developed based on the concepts outlined in The 10 Power Principles of Successful Trading Systems.
Step 1: Selecting a market and timeframe
One of the most popular markets these days is the e-mini S&P, and that's not without a reason: It's a 500 company index. One of the largest in the world and that means you have excellent and consistent liquidity, superb volatility, tremendous leverage and no uptick rule. It's a truly bi-directional market that shorts just as easily and safely as going long. It's a fully electronic market, offering all the advantages of electronic contracts.
We decide to trade the market intraday, i.e. we will enter and exit a trade on the same day, because...
Introduction
The strategy detailed in this article was written almost two years ago and has been available on the forums throughout that time. Since then, there have been many members of Trade2Win who have commented on how it has improved their trading. Even today, two years on, the rules devised are still valid. There have been new "discoveries"- the magic 32 and 64 to name but one, and yet there are still mysteries that have to be resolved.
Even so, this document will probably stand the test of time, which is to help newbies get a feel for trading the Dow, and at the same time, stay in the game by way of capital preservation. It has given me great pleasure in receiving thanks from many members. Truly gratifying. This is just the...