You are using an out of date browser. It may not display this or other websites correctly.
You should upgrade or use an alternative browser.
You should upgrade or use an alternative browser.
Articles
Filters
Show only:
Loading…
Integrating Left Brain and Right Brain Thinking for Balanced Trading
Trading seems so easy on the surface. Traders, while learning a methodology, are told (and believe), "Just follow the rules of your methodology and trading plan and you are on your way to achieving your dreams. Oh, and by the way, keep your emotions in check."
This little add-on after-thought, "just keep your emotions in check", comes to haunt nearly every trader until they learn to master and learn from their emotions. Curiously the highly left brained orientation (logical problem solving skill sets) of trader educational systems blind both educators and traders to the influence that our right brain (our emotional brain) has over a trader's capacity to think...
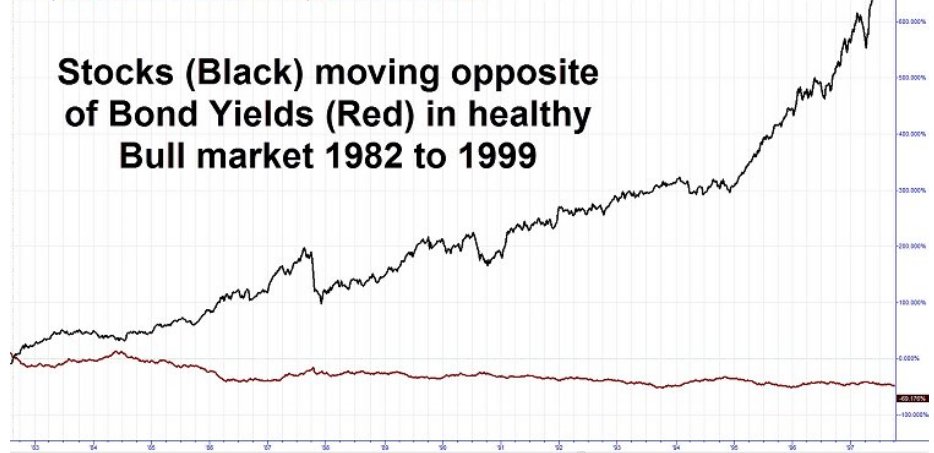
Recently, I had the opportunity to teach a session of OTA XLT Forex. In the class, we were identifying potential trades that were to play out in the next few days to weeks. One of the comments that I made in the class resulted in a flood of emails being sent to me from the students. I was discussing inter-market analysis and mentioned that bonds and stocks tend to move together in the same direction.
This came as a shock to most of the students who believed that the bonds and stocks should move in the opposite direction. In studying to become a Chartered Market Technician, I was required to study the relationships between asset classes, and as a trader, this has benefited me greatly. By understanding these relationships, a trader can...
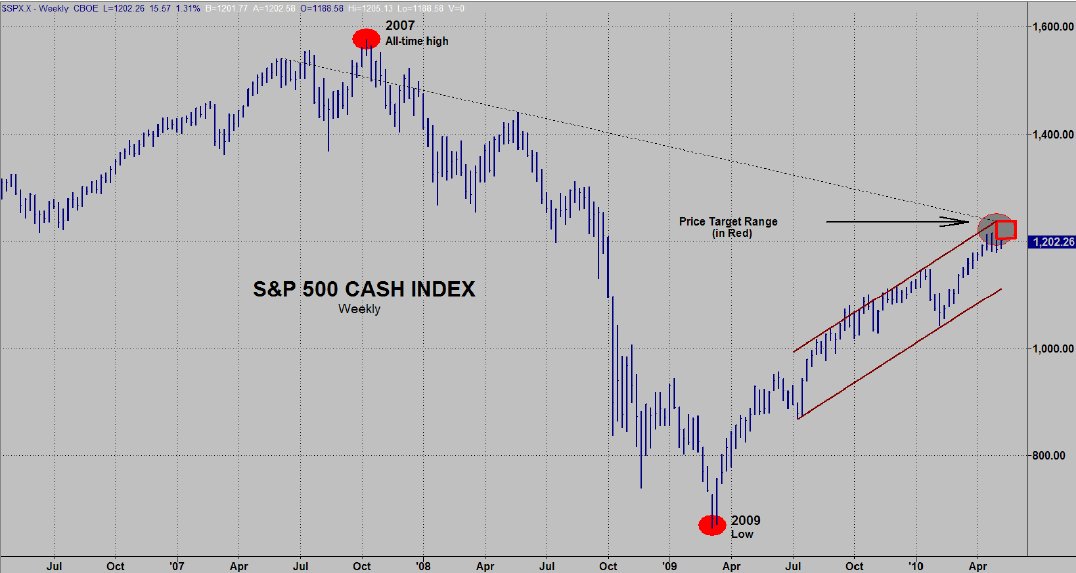
In my view, we are still in a secular bear market and currently at a point of extremely high risk. We have now passed the period of seasonal strength for the year - a time when spirits are high and the market performs better than at any other time on a historic basis. A study in the December 2002 issue of the American Economic Review reported that the average stock market returns from Halloween through May Day (the so-called "winter months") were significantly higher than equity returns from May Day through Halloween (the "summer months"). The findings were that the summer months' returns have averaged so much less than those of the winter months that almost all of the stock market's long-term returns have been produced during the...
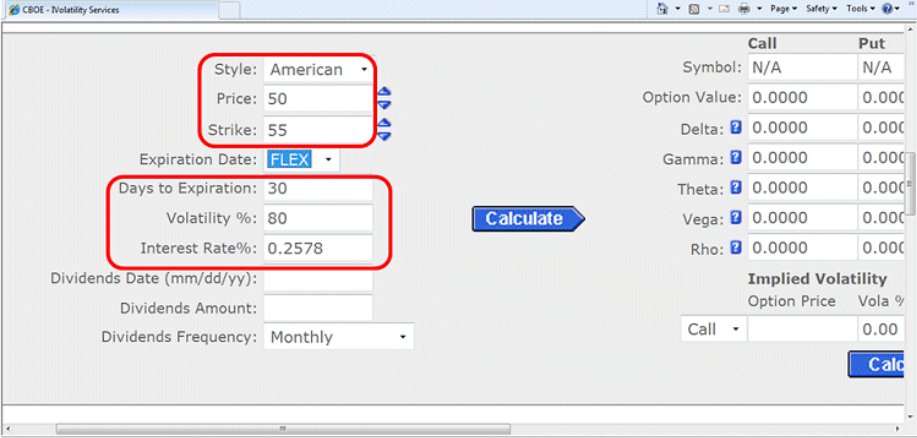
In this article, I will address one of the questions that I have recently been asked. It is on the topic of huge swings in the implied volatility on an individual stock. In order to get to the bottom of the issue under discussion, I have utilized the CBOE's Option Calculator. Here is the question that I was asked:
I own a biotech stock that is currently trading around $50 and I have recently sold some 55 strike covered calls with the expiration next month. The very next day, out of nowhere, positive news came out and the stock jumped $3. However, the value of the option fell by nearly 30%. How can that be?
The simple answer to your question is that the implied volatility decreased, which in turn has caused the premium of your 55 call...
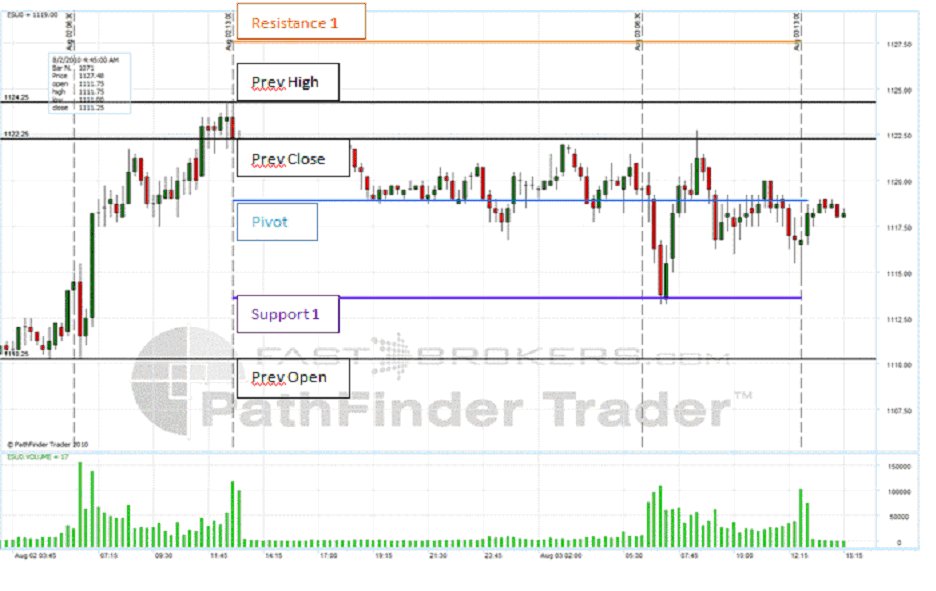
Pivot Points have been used by floor traders at the major equities and futures exchanges for a long time. Traders found that the price tended to hover near the pivot level and trade in between the pivot and support and resistance levels generated by a simple calculation based on the previous day's high low and close. One advantage of using Pivots is they are a predictive indicator as opposed to lagging.
Predictive Vs Lagging Indicators
The majority of technical indicators most traders use such as moving averages and RSI are lagging. Meaning they are telling us what has already happened, or at best, what is happening in real time. Few indicators are predictive; one type of predictive indicator is Pivot Point study. Pivot Points use old...
Learning to trade is much more than just learning a strategy and applying it. In my classes I try to emphasize how important the psychological side of trading is to your trading success. This is why we could give 10 traders a completely mechanical trading system with very specific rules, and at the end of the month, there will most likely be 10 different results. Even though everybody was given the exact same rules to follow, human nature will cause people to override the rules because of the different psychological make-ups we all have.
Here are some of the things that could impact the results of this study:
Some traders will not accept losses and move their stops or worse, not have one in the market
Some traders will place their...
I recently went to watch my 13 year old nephew, Joey, play in a baseball tournament. Every parent / grandparent / uncle is quick to brag about their son / grandson / nephew's athletic ability. I am no different. Joey is an exceptional baseball player. He is exceptional in that he is a switch hitter with power from both sides of the plate. Besides that, he has an amazing ability to draw walks because is so patient at bat. He has roughly 150 at bats with 40 walks and an on base percentage of 600. When I asked him how he was able to be so patient and draw so many walks, he said with a profound simplicity, "I don't swing at crap. It's not that hard." (I could write an entire article about that as it pertains trading).
Joey's...
China was never at the heart of the global financial crisis, yet in the past two
years worries over China's economic future have not been relieved. The media
warned China a year ago about its massive overcapacity and an impending
economic collapse.
Today the case is just the opposite and the international community is more
concerned about China's overheated economy. China's moves to raise overall
wages and to introduce an exchange rate regime reform have topped the
headlines recently. Although China of course faces challenges ahead, we do
not think there is much cause for concern.
China has successfully weathered the global financial crisis, thanks to the
governments massive stimulus plan and the central banks huge liquidity...
I started my career on the floor of the Chicago Mercantile Exchange facilitating institutional order flow. This means taking large buy and sell orders from banks, institutions, money managers, hedge funds, and more, paying close attention to market price, and then making sure those orders get executed and filled at the proper prices. I started in the currency quadrant and was specifically responsible for the Japanese Yen, Canadian Dollar, British Pound, Deutsch Mark, and Swiss Franc markets. The highest volume and most volatile market of this group back then was the Japanese Yen, so that's where much of my focus was.
One of the main reasons for the high volume and volatility was the Bank of Japan (BOJ) as they were very active in this...
Market Profile is a powerful statistical analysis tool developed by J. Peter Steidlmayer and the CBOT during the 1980s. This article introduces traders to the Market profile tool and goes over the basic uses and functions.
Introduction:
Market profile is a technical analysis tool developed by J. Peter Steidlmayer in conjunction with the Chicago Board of Trade in the mid 1980s. Market Profile is a statistical analysis of time and price to create a graphical representation of a trading session or multiple trading sessions. Price is plotted on the vertical axis, and time is plotted on the horizontal axis. Market Profile essentially puts a daily bar or candle under a microscope. By looking at a bar with the naked eye, all we know is where...
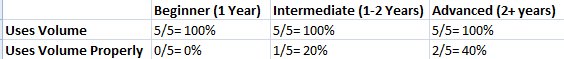
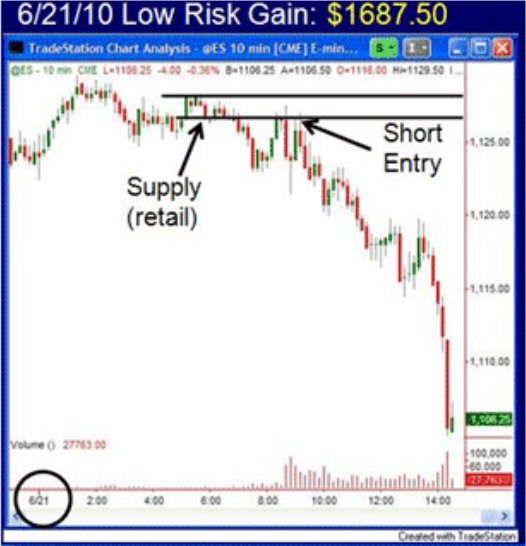
A few weeks ago I talked to 15 different traders: 5 of them have been trading for less than a year, 5 of them have been trading for 1-2 years, and 5 of them have been trading for over 2 years. I asked each of them if they use volume in their trading, and because they know how important I think volume and price action are, they all responded "yes".
Having established that all 15 of these traders are using volume, I wanted to know exactly how they are using it and whether or not they are using it correctly. I remember as a newer trader I always would say that I was using volume but I really didn't know how to properly utilize volume. So I spend just a minute or so showing each of these traders a chart and asked them to analyze exactly...
Trading Psychology - Learn from Tennis Champions to Develop Mental Toughness
Occasionally, we get to 'look' inside the mind of a great performer. This year's programming for the Wimbledon Tennis Championships offered such an opportunity. What many consider the greatest tie-break in tennis history - the completion of the fourth set of the 1980 Wimbledon Men's Final between John McEnroe and Bjorn Borg - was replayed point-by-point with both McEnroe and Borg providing commentary. We got to see and hear what was going on in the minds of two great tennis champions.
Momentum Shift
McEnroe won the tie-break, 18-16, bringing the match to dead-even with one set left to play. Although the match was even, momentum had clearly shifted to...
Since my last Special Alert which was written at the start of May with the theme of SELL IN MAY AND GO AWAY, I have had a lot of calls and e-mails asking if I had written another since. I had not because I saw no reason to veer from the message in the prior Alert. The early May Alert was probably the most technical Alert I have written and I concentrated on the monthly charts. That is not something I usually do. Typically, I only refer to a monthly chart when I think that "bigger picture" viewpoint is seriously worthwhile. My focus was almost exclusively on the monthly charts because I believe the April 26th high was the orthodox top for the recent "reprieve rally" that began with the March 2009 low. When I went over my monthly charts...
Before starting my career at the Chicago Mercantile Exchange, I did two things and really two things only. I played ice hockey and went to school where the focus of my studies was Biology and Genetics. I know what you're thinking, how boring... Well, I actually was and am still fascinated with the study of life so I really enjoyed those days. Around every corner of Biology, Chemistry, Genetics, and so on is another mathematical equation. After diving into this field, I quickly realized that though there were so many equations, the underlying goal of most of these equations was to quantify the forces of "change", "action", or "energy." So, one could argue that all these equations were really different variations of the same thing. For my...
"Rather than maniacally trading volatile pairs multiple times in a single day, rule-based discretionary traders are now holding onto open positions longer, relying more on planning and patience rather than fast reflexes."
Rule-based discretionary traders are among the best traders on this planet. The trading strategy I want to explain here is a rule-based discretionary system. Every trader will face both winning and losing streaks alternatively, so the key to trading successfully is to make more money during a winning streak than you lose during a losing streak.
It's very disturbing that so many traders find it difficult to survive in the markets. The issue is; even if you're disciplined, it'll be difficult for you to survive with a...
There may be an unlimited number of approaches to the markets and their usefulness may be both obvious and questionable. As mass psychology is a basic engine which drives markets forward, so the analysis is derived from market psychology and as such it may seem more attractive than it actually is. On the other hand sound analytical methods do not get significant attention at times, as they are effective but not necessarily "promising" and give traders the truth, which sometimes may be hard to accept.
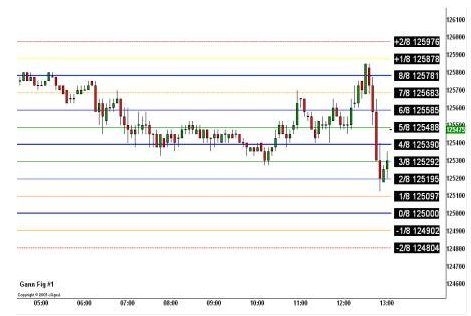
In the March 2005 edition of "Futures" magazine the ODI (Option Deviation Index) was presented, which takes measure of market fluctuations based on the entry point (Fig.1). The result is calculated as a percentage of entry value divided...
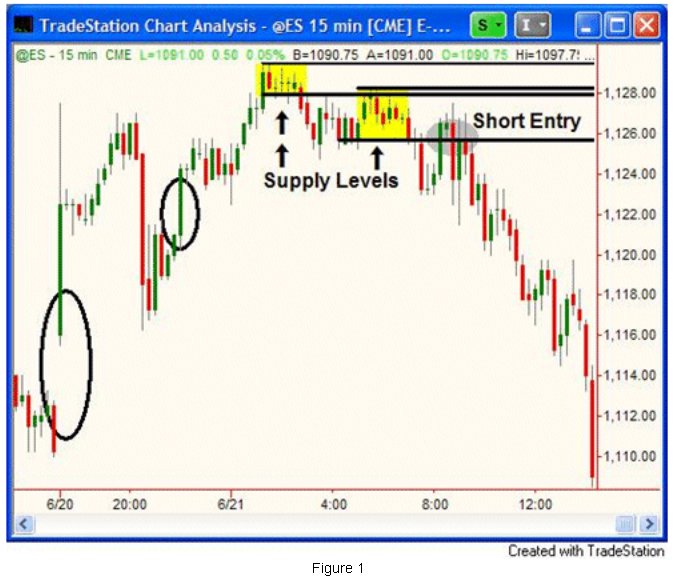
Debra looked at the candle on the daily chart. It was yesterday's candle and it was red just like several before it; and it looked good. You see, it represented a pull-back from a high several days ago on the YM E-mini. The high was the latest in several higher highs and higher lows that stretched back a few months representing a strong upward trend. What looked attractive to her was the fact that the price action had bounced off a 10-period and a 15-period exponential moving average several times, and as well the highs pulled back off significant resistance levels several times. On this day, the price action's pull-back was hitting a significant support level, which also happened to be coinciding with an upward cross-over of the two...
In my top 3 books about trading rests Trading in the Zone by Mark Douglas. I found this book to be the most helpful trading book in my earlier days of learning to trade. I find it interesting that one of my favorite books on trading doesn't have 1 chart, indicator, setup, or any full methodology within its pages. It is almost entirely about individual trader psychology, and I have learned that this is the crux of the trader's issue. The traders mind, both friend and enemy, both roadblock and engine.
Mark Douglas, in this book, was the first to introduce me to trading in samples. I had heard about it in passing, but never paid any real attention to it as it seemed to me an obscure way to deal with trader psychology. Why not just focus...
As we come into the growing season for many of our agricultural Commodities, there will be numerous opportunities to trade the volatility created by weather, crop estimates and other fundamentals. I mention the agricultural markets because they offer some of the finest opportunities. However, other markets can be spread, also.
For example, here are just a few:
Ten Year Treasury Note / Thirty Year Treasury Bond
Live Cattle / Lean Hogs
Euro FX / Aussie Dollar
Gold / Silver
Spreading offers the Futures trader an opportunity to trade these markets with less capital than on outright Futures position, while being hedged at the same time. This hedge does not mean you cannot lose money, it simply implies you are long one Futures...
Whether you want to be a fundamental trader or technical trader, you need to have a sound understanding for how markets work. As a price action trader, economics major and trading educator, I fully understand how markets work, but do you?
There are tens of thousands of trading websites and thousands of different trading methods being sold on them, most of which never really explain to you, the trader, exactly how or why they work. To me this is just shady business practices from these companies, and is more times than not due to the fact that these methods either don't work or the person in charge of marketing these methods doesn't know how they work. I am writing this article wearing the shoes not only of a full time trader and...
W D Gann had a number of approaches to predict market action. His techniques have been regarded as complex and difficult to implement & understand due to the lack of clean information he left. His 'Harmonic Rule of 1/8's is not to be confused with his more widely recognized 'Square of 9s' method.
Gann's Rule of 1/8's is based on specific arithmetic geometry, more specifically 'fractal arithmetic geometry'. When that 'geometry' is constructed properly, (Gann referred to them as 'Octaves, Squares or Boxes), we can apply a set of rules that has predictive capabilities in any market that can be plotted. Does the predictive outcome, using the rules, work all the time? NO. Losing is part of trading. As traders, we attempt to eliminate...
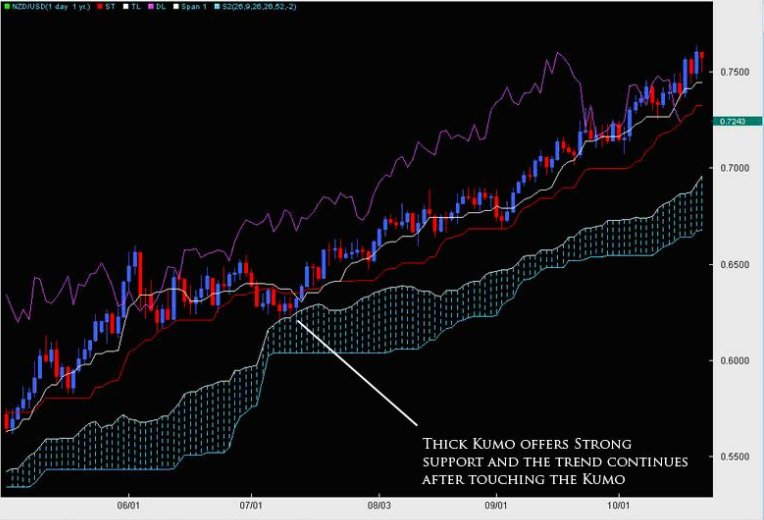
Still growing amongst the Western and European traders, the Ichimoku Cloud (or Ichimoku Kinko Hyo = One Glance Balance Cloud Chart) was originally developed pre-WWII by a man named Goichi Hosada. Because of the war, his research was halted and then later finished in 1968 whereby he published a 1,000 page, four volume body of work releasing the Ichimoku Cloud to the world under the pen name Ichimoku Sanjin.
Originally built for the Japanese stock markets, the indicator has made its way out of the land of the Eastern sun and into the trading world at large, being applied and used widely in the Commodities, Futures, Options and FOREX markets. Part of its success is its ability to find trends and reversals well before they begin.
The...
The Wrong Questions:
Whenever I get emails from newer traders, they consist of questions like "How Can I Make A Lot Of Money?" and "What Method Can I Use To Make A Lot Of Money?" and "How Should I Know When To Buy And When To Sell To Make The Most Money?".
Just by reading the questions asked in the emails I can tell the experience level of the trader. I usually don't even give a straight answer to these emails since these are the types of traders who are destined to fail in the first place. Remember that about 90-95% of traders end up losing money, and that is simply because new traders are getting involved in trading for all the wrong reasons. My typical response is something along the lines of "You need to learn what to ask and how...
FALLING IN LOVE WITH A TRADE
How Loss Aversion and Regret Impact Trading Performance
In his book, Blink, Malcome Gladwell describes an event where the experts from the J. Paul Getty Museum in California encouraged the museum's purchase of a marble statue purported to be from the sixth century B.C. The statue was an amazingly rare piece with an estimated value of just under $10 million dollars. There was only one problem. The experts from the Getty museum failed to detect what outside experts had suspected and then later confirmed; the statue was a fake. So why were the Getty museum's experts not able to confirm what outside experts suspected at first glance? Because the Getty museum's curators desperately wanted the statue to be...
12:05 Appraisal time. I'm back in my office, munching my sandwich and typing with one finger. The first one is Mike, which is actually pretty easy. He's experienced, thoroughly competent, and as far as his interactions with spot trading are concerned he's a model citizen. Done. Next! This one's tougher. It's a girl called Carla, who heads up the middle office functions here. I can't say we've always seen eye to eye if I'm honest. We've had a few run ins over the delivery of P&L and risk reports (both in terms of timeliness and also with accuracy). She's not producing them herself, but my personal thought is that she's had long enough now to whip that team into shape, having come over from our rivals, I heard, at no small expense to do...
06:00 Alarm goes and I'm out of bed. Hopefully I have managed to sleep all through the night, although on odd occasions I will get a phone call or a text message if anything particularly important is up. Not so often these days though. The people I work with know how much I value my beauty sleep. Quick shower and shave and I'm usually out the door some time before 0630
06.30 On the way to the tube station I will have a quick scan through the news headlines on my phone, check my e-mails, check the spot market levels in Asia etc. By the time I get to the tube station my phone has downloaded all the early morning research pieces that I've been sent so I have something more stimulating than the free papers to read on the train. It's a...
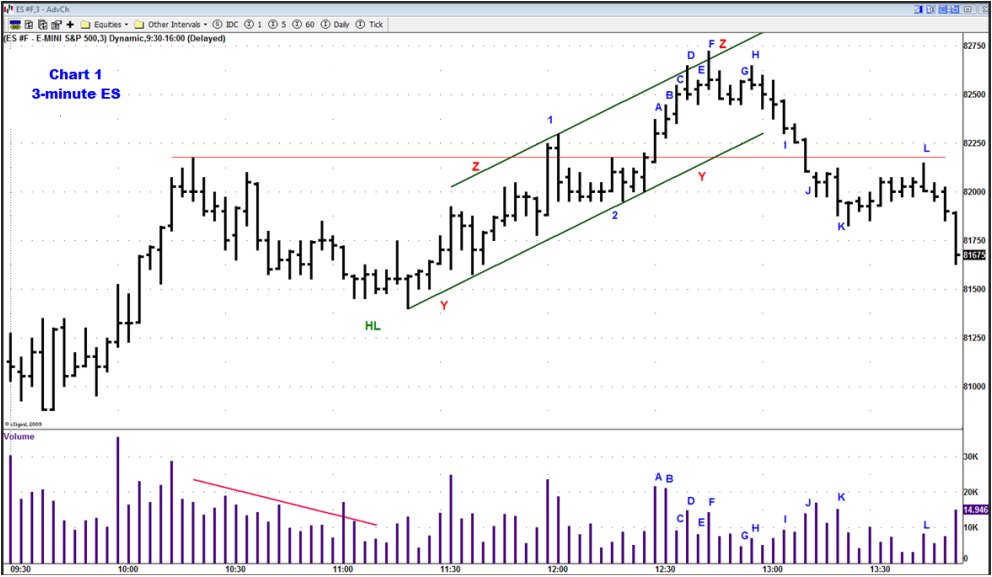
Here is an example of using the Bar-by-Bar method to read the market based on its own actions via Wyckoff Method of Market Analysis. This example shows how to integrate background conditions or market structure, trend lines, multiple time frames, and the individual bars as it unfolds on the chart. This is from the S&P e-mini market on 3 and 15-minute time frames. The method is applicable in any market on any time frame.
Chart 1
Background - Price rallied after the open, and then spent an hour reacting in a slow drift down. Volume was less on the reaction than the volume on the rally off the AM lows (seen by the red line). Spreads were also generally narrower on the reaction, and as the reaction progressed, volume receded. A...
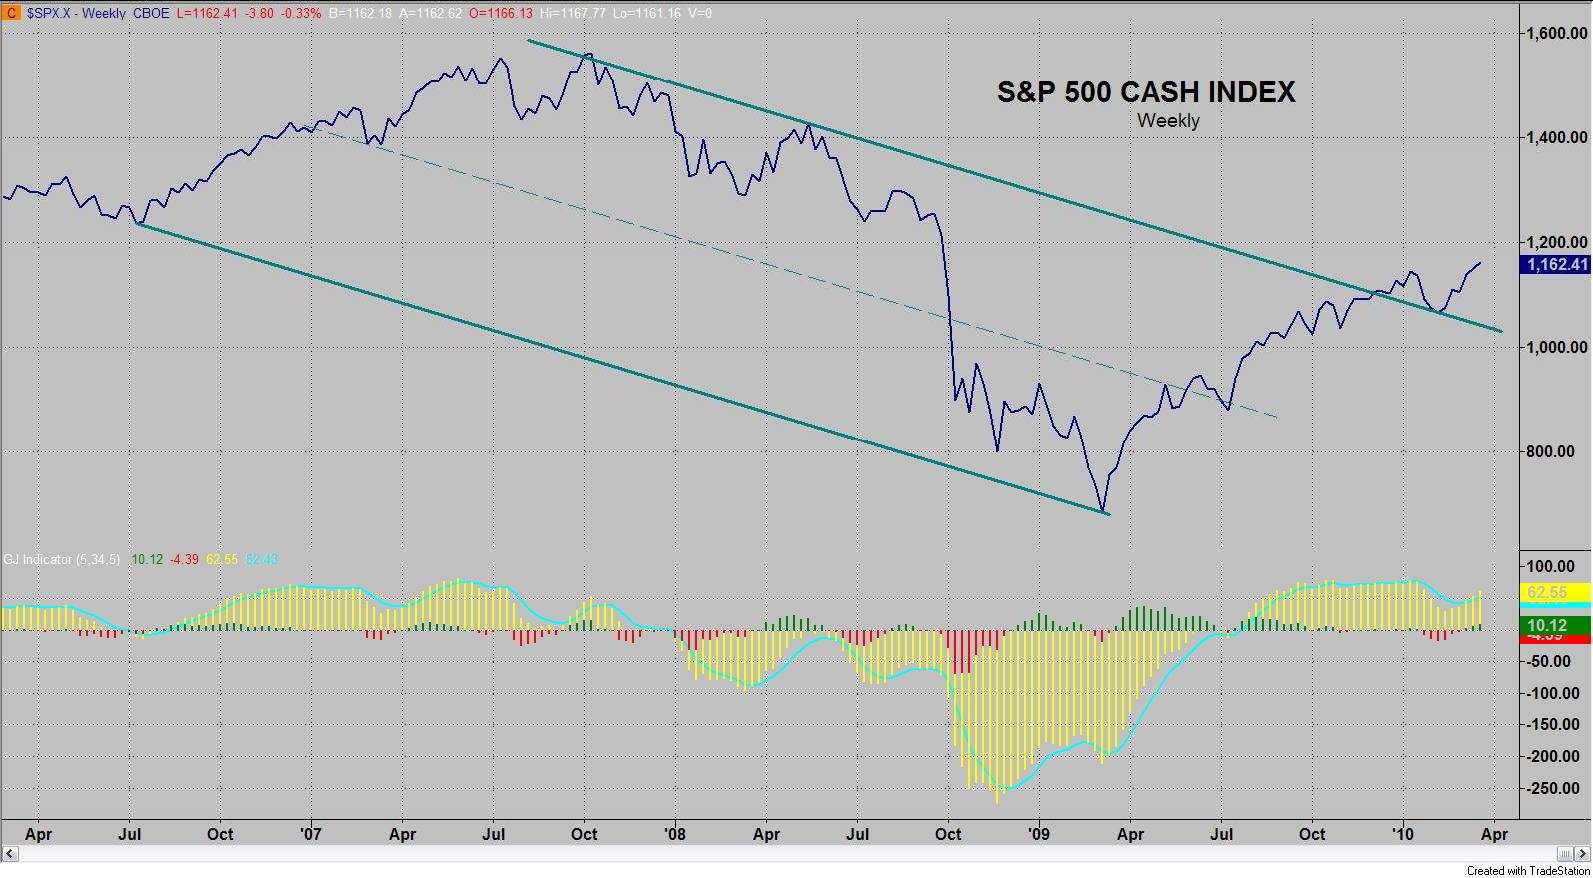
In my view, we are still in a secular bear market and at a point of high risk. However, we are now in the seasonally strong time for the year - a time when spirits are high and the market performs better than at any other time on a historic basis. A study in the December 2002 issue of the American Economic Review reported that the average stock market returns from Halloween through May Day (the so-called "winter" months) were significantly higher than equity returns from May Day through Halloween (the "summer months"). The findings were that the summer months' returns have averaged so much less than those of the winter months that almost all of the stock market's long-term returns have been produced during the winter months. The obvious...
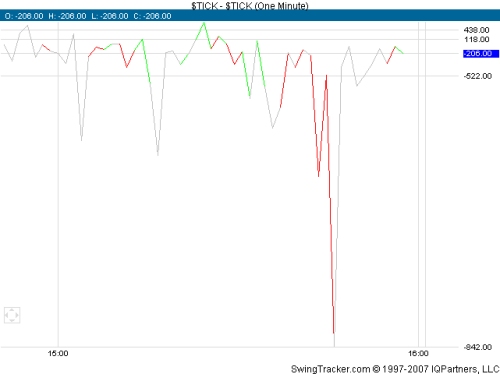
For daytraders and scalpers looking for a quick trades or even a bit longer hold from 5 minutes to 1 hour, it's not easy to do. When day trading stocks, not knowing which way the market will go or the sentiment of the next few minutes is the fastest way to go broke. So watching the breadth such as the composites such as NASDAQ, DOW, or S&P 500 is a fundamental tool used to day trade effectively. Getting an idea what the immediate sentiment is crucial is seeing when and where the buyers or sellers are coming. Believe it or not, stocks are not islands and are not random. Participants move in and out for reasons others prices of stocks. There is always a correlation to some type of data, be it news or other related stocks. So finding a...