You are using an out of date browser. It may not display this or other websites correctly.
You should upgrade or use an alternative browser.
You should upgrade or use an alternative browser.
Articles
Filters
Show only:
Loading…
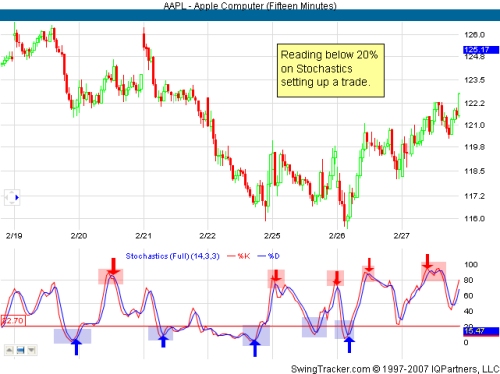
There are a lots of words thrown around in trading terminology but no one really understand truly what they mean when it comes down to trading and reading the text to truly understand what the author wants to say. This word "setup" in particular is an all-encompassing word. So some clarification is needed.
The setup means different things to different authors. In general, a setup is an area (price or indicator) where he would take action; this can be opening a position or closing one. The setup has to meet a number of criteria either from price, volume or any number of indicators being used. Setups can come at different times of the day or weeks. For a scalper, one setup may appear one after another, providing him many opportunities...
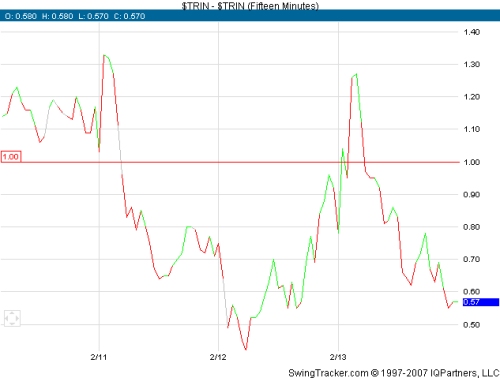
Like any other day traders, we are always looking for correlation in other markets or indicators to give us an edge. It's not easy when there are lots of data and techniques out there to choose from. Those that are out there simply work in one market but not in others while more work at one type of market condition and not in others and so on.
Scalping and day trading in particular has a peculiar type of behavior where everyone wants to know what the market will do in the next minute or so in order to catch a small tiny profit -- little by little to accumulate with highly leveraged trades. That said, every weapon helps to avoid losses and to add to the higher probability of success. Percentage is everything in this type of trading, the...
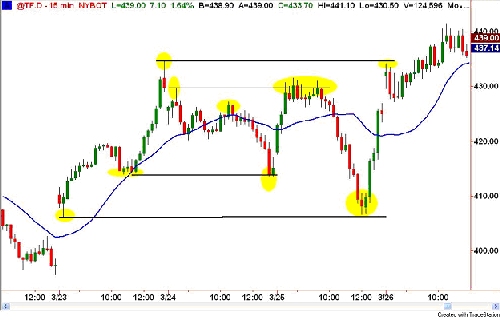
Of all the facets of trading, the first that a new trader must learn before he can engage the markets with any degree of confidence is the identification of low risk entries on a price chart. Notice that not just any entry will do, only those offering the biggest reward for the least amount of loss potential.
If you've ever read about or had the chance to chat with any successful trader, you will find one common thread: They all (without exception) have an edge based on low risk entries.
What defines a low risk entry? I define it as the following: The price level where a trader can expose the least amount of capital to prove whether his edge will work. I tell students to look for these areas by identifying "the line in the sand" or...
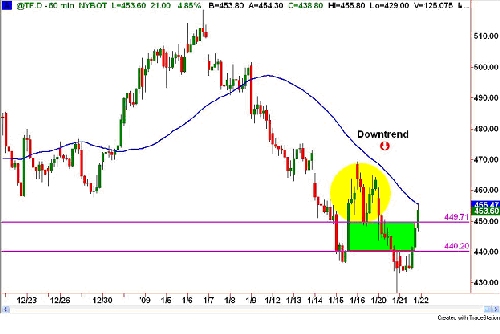
One of the challenges a new trader faces - amongst many others - is finding the optimal time interval for the candlesticks being plotted on their charts. The trading approach or style one implements will of course, have a big influence. For instance, a swing trader (one who intends on holding positions for days and weeks) will have little use for, let's say, a 144-tick chart. On the other hand, a day trader may find tick charts an essential part of his analysis.
The most commonly used time frames are 1, 3, and 5-minute candles. When deciding which period to utilize, one must keep in mind that the shorter the time frame, the noisier the chart. In other words, the shorter time frames generate many more signals; however, those signals...
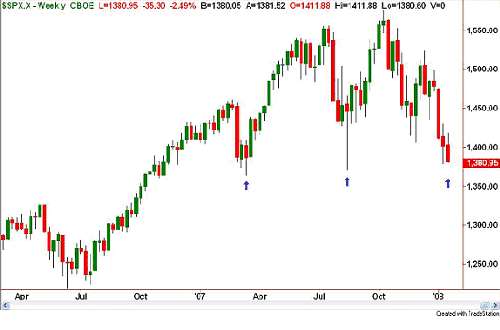
First, it was Citigroup disappointing with their earnings shortfall, and this, along with less-than-stellar retail sales numbers for December, sent stocks roiling on Tuesday. The Dow and S&P finished the day lower by more than 2%. To add insult to injury, Intel's lackluster earnings release after hours pummeled those shares, setting in motion a plunge in the stock index futures. Translation - the market's in for more selling (at least in the early part of the year).
Can things possibly get any worse? Yes, they can. People seem to possess very short memories. After all, it's only been 4 years since we suffered through one of the worst Bear markets (caused by the technology-led recession) in history. How bad did things get then? From the...
Producing a high probability trade forecast is not easy. Just as difficult is determining the best trading strategy and vehicles to capitalize on the forecast. Read on to learn some of my favorites trading strategies.
Let's say you've done your homework. You've identified a pivot point, a futures market direction and have projected a time frame for the move. The only thing missing is the price amplitude. In other words, how big or small will the price move be?
Generally, the magnitude of the move will always be the unknown. With TimeLine forecasts we will always have an idea of the direction and time frame, but it is up to real world commodity market forces to decide how far the move will carry.
The way to handle price uncertainty is...
There is always "year one" for every commodity futures trader. I had mine and made every mistake a trader can make and more. Here's my story of how I stumbled into the lion's den, got gored a few times and even made some money. My hope is that beginners will read this and avoid some of the more obvious stuff. Here's to all new traders!
It all started in the spring of 1979. I was 28 years old. I was in the office of my new retail electronics company. I was going over some paperwork and got a call from a young and excited broker from Boston Commodities, or some name like that. He must have had the list of new businesses and was cold calling the small business owners.
I had no idea, but at the time sugar was in a major bull market...
Remember that hit movie "Lost in Translation," in which a clueless Bill Murray wanders dumbstruck through the foreign and thoroughly baffling world of modern-day Tokyo? That's the look that comes over many forex traders when they try to get their head around the Internal Revenue Code as it relates to foreign exchange trading.
Forex is the world's largest and most liquid market, with a daily currency dollar volume of more than $1.4 trillion. Once primarily traded by banks and other financial institutions, forex opened to individual traders in the mid-1980s and became widely popular when trading exploded in the nineties. Forex can be lucrative indeed for traders who know how to capitalize on the rise and fall of various currencies...
Most commodity futures markets will tip their hand when it's time to reverse direction. Knowing how to read its language is the challenge. It's not easy. This is important information, since this is all you really need to know! Volatility is a clue as well as price synchronization. Read on about these unique observations. This information can be applied to most any freely traded market of any time frame.
Observation Trading Notes:
Keep watching the five minute futures chart with the horizontal line tool to see price support and resistance. Then confirm this action on the one-minute charts.
We have all seen the stair step action of a trending commodity futures market. Sometimes you can keep buying those corrective spike dips into the...
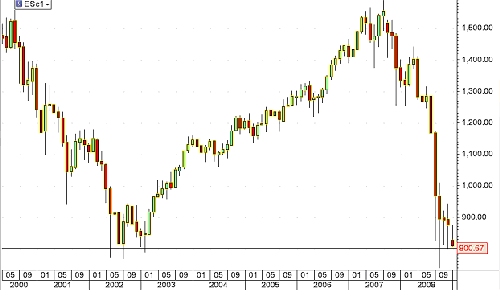
Many regular readers of this column know that I sometimes use cross-market analysis to find Forex trades. If you think that sounds complicated, keep reading and you'll see that it's easier than it sounds. You might recall last October's article, "Using Stocks to Trade Forex," where the S&P was used as an indicator to trade the GBP/JPY currency pair. Recently, a trade setup presented itself where I was able to use a major support level on the S&P 500 as an indicator to place a trade on another currency pair that is known to follow that index.
Let's begin with a very long-term look at the S&P 500; we can do this by checking the continuous monthly chart of the E-Mini futures contract. From this chart, it's very clear that the 800 area...
This article is aimed at all those new to trading and we look at the basics of what technical analysis actually is.
What is Technical Analysis?
Technical analysis is the study of price data and statistical indicators that are formed by market activity. Market activity illustrates the flow of supply and demand. This supply and demand is a reflection of beliefs and opinions translated into human behaviour and specifically, herd mentality. Therefore, technical analysts would argue, price patterns and indicator signals can be categorised based on historical data with a reasonably high expectation that they will occur again at some point in the future. This argument is based on the theory that human behaviour is innate and, although it...
There are really no "secrets" about how to invest successfully. There are lots of good ideas out there in plain sight - in books, newsletters, magazines and more - and you can acquire them cheaply.
The problem is there are also lots of really bad ideas about investing out there too. Most people can't tell the difference between the two. This makes it hard to create a winning investment strategy. It would be like trying to make apple pie without knowing a ripe apple from a rotten one. That's problem No. 1.
The second difficulty is that even when you find the genuine article - a timeless bit of investing wisdom - it is not something you can use to great effect in isolation. In other words, the "secret" to creating a successful investing...
In this article we take a look at what the IRS requires for you to be called a trader and what forms are required to be completed with your yearly tax returns.
Just because you call yourself a securities trader doesn't make you one in the eyes of the Internal Revenue Service. In fact, Uncle Sam is predisposed to consider you merely an investor, and thus deny you more favorable tax status, unless you meet a number of tests that are frustratingly open to interpretation.
That's right: the tax code contains no actual definition of trader status. Instead, the IRS has issued guidelines that the courts have further delineated by case law, most of which denied taxpayer appeals. What we're left with is a blurred image, like a photograph of a...
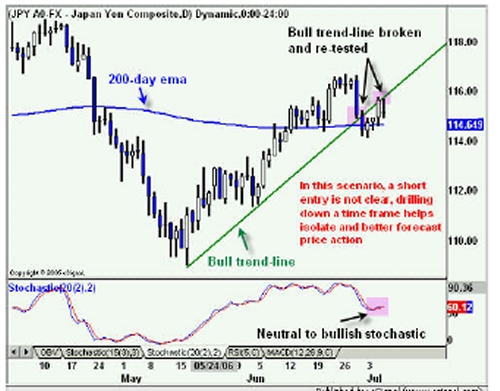
Given my background as a scalper in the equities market for eight years I am often asked if those same techniques are applicable to the FX market. First, it is important to define how one defines scalping. First, recalling my days as a floor/screen based trader of equities in the 90s the definition was a technique whereby a trader could profit from very short-term moves in the marketplace by using a combination of 1 & 5-minute charts as well as a keen sense of tape reading. When I made the transition to the FX markets exclusively back in 2001-02 I was keenly aware that this type of hyper strategy had 2 shortcomings:
It was not scalable
A scalping technique may not be conducive to the FX markets
While point 2 may be open to...
The six stages of a developing trader are looked at below.
Stage One: The Clueless Trader
This is the first stage when you enter trading. You may have picked up a book on technical analysis somewhere, heard of a day trader making millions, or got lucky in an earlier stock investment. After all, how hard can it be? The money sounds appealing and the freedom to be independent sounds attractive.
I don't mean to shatter anybody's dream but those who succeed in trading are the minority! Approximately 90-95% traders lose money. This is the cold hard facts. In the first stage, every trader is optimistic. You open a direct access brokerage account and the sound of Level II, ask/bid, and market makers make trading sound like hi-tech video...
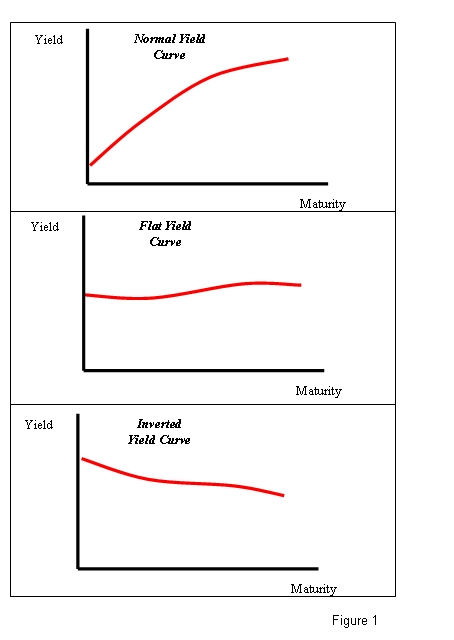
As of this writing (March 17, 2008), the status of interest rates sends some important messages to the stock market investors. This article aims at reading and decoding these messages.
Debt Securities and the Stock Market
In his book, "Intermarket Technical Analysis" (see [2]), John Murphy stresses the positive relation between the bond market and the stock market: "The bond market usually leads the stock market". This relation is not limited to long term bonds but it also extends to debt securities of all maturities (T-Bills and T-Notes). There are three main reasons this relation exists and all of them are based on the fact that the debt securities prices move in the opposite direction of the interest rates:
1. When interest rates...
Virtual Trading (VT) is a general term referring to hypothetical trades made by a trader for either practicing or for evaluation of his/her methodology. You may have also heard the term "Paper Trading" which is usually used interchangeably with VT. In fact, the days prior the rush of personal computers in all aspects of life (trading included) virtual trades were done on paper instead of being done in a real account hence the term "paper trading". Nowadays the astounding massive use of personal computers and the extensive use of internet have made virtual trading possible in an amazingly convenient way. The virtual trader does not have to adjust his notes for corporate actions, dividends and other labor intensive stuff. All these can...
As a trader you must have three pieces working in synch. Your equipment, your trading tools, and your mind. The Art of War by Sun Tzu is a book that has been applied to every facet of human experience. While originally meant to be a book that taught war strategies the lessons it imparts can and will change your life.
Students of the market are constantly battling between the emotions of fear and greed. The Art of War can help you cut a path between these two emotions and lead you to a mental place that will constantly help you put your best foot forward. In this series I will address various poor trading habits by excerpting and interpreting various passages. While my interpretations are not meant to be definitive by any stretch of the...
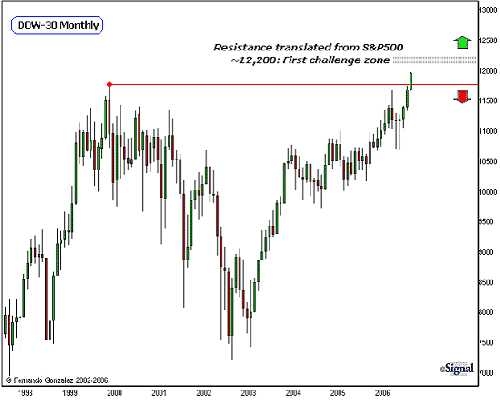
With the Dow making new highs last week, we are now well and truly into unchartered territory. So how should you define the new targets?
The action over the last week satisfies an expectation we have had for the year 2006: a fresh all-time high. The move into new-high territory was not an easy breakout. In May, the DOW crept to within 90 points of an all-time high and thereafter sold-off to lose 8% of its value throughout the next couple of months - this was one of the strongest pullbacks the market had since the major low in 2002. In July, the market found its footing and once again made a second run for its all-time high. It has been all-up ever since and into today. Here's a toast to the Bulls for a well earned victory! Now it's...
Can a sector rotation strategy improve performance of investment returns? In this article the author looks at sector rotation within the US markets.
Investors can most certainly use a sector rotation strategy to produce returns which outperform the market, or even some hedge funds, despite what was described in a recent article. Many hedge funds would be wise to consider such a strategy. However it's not as easy as the plan described in the article's abstract. Nor should we expect it to be; the market is not easy-pickings. But recognize what market returns we are talking about: since say 1990, the S&P has had about an 8 pct compounded annual rate of return, while experiencing about a 46 pct maximum drawdown. Those numbers can be...
I was recently asked about stops and different types of market orders. They were good questions and they reiterated to me the fact that I work with people that range from seasoned trading professionals to those testing the futures trading waters for the first time.
One thing I always like to point out to the less-experienced traders: There are no "dumb" questions and there is no shame in being inexperienced. Every single futures trader that ever walked the face of the earth has been inexperienced at one point.
This section on types of market orders, including stops, may be a "refresher" feature for the more experienced traders, and will likely be a more valuable feature for the traders newer to this fascinating field.
Market Order...
The decision to trade online or through a full service broker will undoubtedly make a large impact on your bottom line. However, the impact may or may not be what you had in mind. If you aren't ready to begin placing your orders online on your own, despite saving money on commission it may be the most costly mistake that you ever make.
While commission is baggage, a slightly higher rate it may be worth every penny assuming that your broker is truly giving you what you are paying for - reliable and efficient execution along with quality guidance in strategy and analysis.
Hopefully this article will open your eyes to the realities of transaction costs. While experienced traders should look for low rates with quality service, novice...
Davie Grant is a trader with more than a dozen years' experience. In this interview he shares his personal methods and philosophies for success.
Starting Out
How long have you been trading for?
Approximately 12 years.
How did you first get involved in trading?
I bought some penny shares in a company called "Sleepy Kids" which a tip sheet publication had recommended.
Do you remember your first trades?
Oh Yes! I was doing stuff that I would never dream of doing now. Basically I was following this London "tip sheet" and all its recommendations on "Penny Shares".
What were your first few months like? Were you profitable initially?
Initially I did very well. I had good success with the company "Sleepy Kids", which tripled its share...
John Bartlett, through this interview, provides new traders an excellent direction as they pursue their own development.
Starting Out
How long have you been trading for?
Approximately four years. 1st year foolishly, 2nd year not so foolishly (started to study), 3rd year break even and this year profitably.
How did you first get involved in trading?
My background is financial services, about 10 years prior to finding trading I dabbled in traded options, I lost interest
when it didn't make me rich in a few weeks, I blew my trial bank and forgot
about it, continued selling executive pension schemes and and a friend sent me a
mail shot from someone charging a lot of money to teach spread betting on futures and shares. It started from...
Alpesh Patel is one of the best known traders in the world. In this often light-hearted interview, he shares some of his experience and philosophy.
Starting Out
How long have you been trading for?
Bought gilt edged bonds at age 12 back in 1983. The Chancellor did not call me to thank me for buying Her Majesty's Government debt, but a £100 probably did not save the nation.
How did you first get involved in trading?
Wanted to earn money whilst at school (and whilst my parents toiled 18 hours to send me to a public school) and the idea of company employees toiling to make me money whilst I avoided a paper round all because I bought some stock sounded like a darn good idea. Still yet to get a proper job. Viva capitalism - who has the...
When you begin trading, the one thing you want most is success. You are trying something new. Most traders first starting out feel unsure, a bit uneasy. You're taking a chance with your hard-earned money; there is big risk involved. I don't know of any beginning trader who plans on failing, yet the possibility is there, and it is beyond your imagination to consider what you'll do next in the event you fail. It has been our experience here at Trading Educators, that many beginning traders never even consider failure as a possible outcome of their attempt at trading. In fact, it is often just the opposite. Apart from being a bit apprehensive, most feel impervious to failure, if they think of it at all. I have never met a beginner who had...
A vastly experienced trader, educator, author, and inventor of the famous 'Ross Hook', Joe Ross took some time out of his busy schedule to talk to Trade2Win.
Starting Out
How long have you been trading for?
46 years.
How did you first get involved in trading?
I was taught by my great uncle Julius.
Do you remember your first trades?
Yes, it was a cotton trade. My uncle had a seat on the cotton exchange.
What were your first few months like? Were you profitable initially?
My first few months I was petrified. But I traded profitably under my uncle's supervision.
Has your trading style changed radically from when you first started?
No! I was taught discipline and self-control. I was taught to find the markets and time frames that...
So why do I trade US shares intra-day?
The prime mover market in the world is in the US. Here in the UK we are essentially influenced by the US economy and its stock market. How many times, for example, have you seen the London market open at a level dictated by what happened in the US the previous evening after London closed? Of course, the Far Eastern and European markets have an influence, but although they, like the UK, do have substantial domestic and local factors, they are also largely driven by the United States.
Clearly there are advantages to trading the principal world stock market rather than the others. For example, you are in at the beginning of a move, seeing the immediate reaction to changing dynamics and trading...
So you want to work in the City?
There is no shortage of ambitious young individuals who dream of, and aspire to, a successful career in the City. Images of Rolex-wearing, Porsche-driving twenty-somethings living in their Docklands bachelor pads does nothing to stop the swell of wannabe City Slickers.
But just how real are these images? More importantly, how can I get to work in the City, and where do I start? What are the upsides to a career in high finance? What are the downsides? Which are the best markets to work in? What qualifications do I need?
Those images born from the movie which made the slick-haired Gordon Gecko famous have undoubtedly created one major drawback for any ambitious young individual wanting to work in the...
