You are using an out of date browser. It may not display this or other websites correctly.
You should upgrade or use an alternative browser.
You should upgrade or use an alternative browser.
Articles
Filters
Show only:
Loading…
I have found that traders usually fail for five primary reasons:-
1. Lack of trading skill
2. Lack of risk capital
3. Improper trading psychology
4. Lack of support
5. Lack of experience
1. Lack of Trading Skill
Usually new traders are so eager to make a killing in the market that they are just too impatient to learn how to trade before trying to trade. Basically, they either wing it, or think they know what they are doing without objectively determining their skill level.
If new traders can get the dollar signs out of their eyes and focus on developing their trading skills in a stress free, fun environment, they will be off to a good start. I encourage new traders to ‘paper trade’ first, so that they can practice their trading...
Have you ever heard something like: ‘The market is a battlefield, be ready to fight with all you've got’, or ‘The market is a war’, or a variation of this theme? I bet you have, it's a fairly common theme. Enemies may change, but the theme stays the same. The market maker is an enemy one day, the specialist the next, or the quant’s, the algo’ traders, the high frequency traders or the Federal Reserve traders etc. I’ve run out of names here - you may remember more. The question is: is it true - are these people really your enemy? Or, a better question might be: is the mindset - ‘that the market is a battlefield’ - one that you really want to adopt?
The reason I pose the question this way is because trading is not a purely intellectual...
Many traders use indicators to determine when to enter and exit trades. Most charting software includes dozens of different indicators that can be displayed on the charts. Popular indicators such as the Stochastic, and MACD, are frequently discussed when traders get together. I have listened to a number of these discussions; the interesting thing is that people typically explain why they use a particular indicator by citing a number of examples of when it has worked for them. When they do, another trader will typically say something like, ‘well it did not work for me, so I use the XYZ indicator which is much more reliable’. When I ask the second trader why his XYZ indicator is more reliable, the explanation usually involves a few more...
How often have you seen something that upon closer examination turned out to be something very different? Or, have you ever looked at the price action and acted upon what seemed to be a perfect price pattern; then wrote your plan, executed the plan, and summarily were stopped out; only to go back to what you thought was the price pattern that now looked entirely different?! It was like a dream. What you perceived was predicated upon how you “filter” information. You interpreted what you saw through mental models of how the world appears to be. In other words, what you “see” and interpret as reality is created by internal working “models” in your mind. Mental models of the world are formed in your earliest years of development and...
Man v Machine
In 2006 I had a very interesting meeting with a Professor of Finance at a university in London where they were launching a Masters Degree in Financial Trading. We had a good discussion about the world of trading and he was very much a believer that the future of trading was automation and saw a terminator style rise of the machines occurring over the next few years. He told me that their masters program was all based around automated trading and also suggested that I might like to possibly consider a new career as, within the next few years, there would be very few human traders left for me to work with.
During the course of 2006 I worked with a lot of traders in 1-to-1 coaching and workshops, and one repeating request...
Fibonacci analysis leaped into the technical mainstream late in the 1990s. Futures traders had been quietly using this charting tool for several decades when Net-based, real-time software ported it to the equity markets. Its popularity exploded as at-home traders experimented with the arcane math and discovered its many virtues.
Leonardo of Pisa (c. 1170-1250), also known as Fibonacci, studied math among the Arabs and introduced algebra to Europe, as well as a numerical sequence that appears throughout nature. The core logic of his discovery is simple: beginning with 1+1, the sum of the last two numbers that precede it creates the next value in a Fibonacci progression.
So with this math in hand, the starting Fibonacci sequence looks...
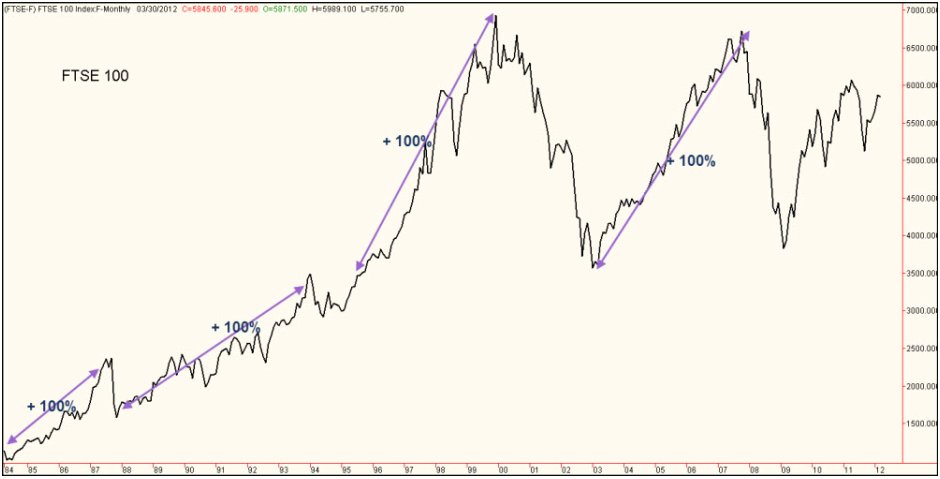
So, an analyst at Citigroup reckons that the FTSE 100 should double in value over the next 10 years. Actually, were that to happen (but see below) it would be no big deal as the FTSE has doubled in value no less than 4 times since its launch in April 1984 and, each time, it has taken far less than 10 years to do it –
April 1984 @ 1150 - doubled to 2300 by May 1987 = 3 years
Oct 1987 @ 1580 - doubled to 3160 by Sept 1993 = 6 years
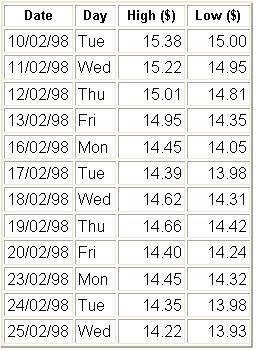
June 1994 @ 2900 - doubled to 5800 by Feb 1998 = 3.75 years
March 2003 @ 3500 - doubled to 7000 by Oct 2007 = 4.5 years
So, on the face of it, the idea that it might double over the next 10 years is no great shakes; history of the FTSE shows that it could do it in the next 3 to 5 years, tops! But - and...
The Articles section of T2W is a veritable repository of trading knowledge, experience and ideas. It’s compiled with one aim in mind: to help you achieve your trading objectives. At the time of writing (March 2012), there are 468 articles in total which, between them, have received well in excess of 4.6 million views - and counting! There are contributions from some of the best known experts in their field, including: Jake Bernstein, John Bollinger, Linda Bradford Raschke, Dr Alexander Elder, Steve Nison, William O'Neil, Martin J. Pring and Brett N. Steenbarger - to name but a few.
However, unless you’ve been a T2W member since 2005 and diligently read all of the contributions as and when they were published – you’ve got a mountain of...
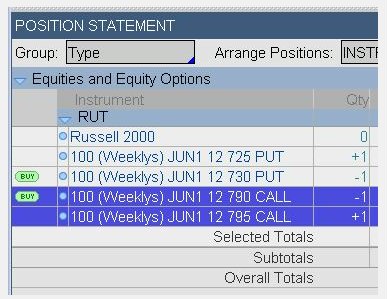
Never buy stock again! Fortunes can be made in the securities market, but there is a better way than buying stock for the long haul. And that better way is the use of stock options, a little employed technique that is known by few, except as a speculative technique akin to gambling. The purpose of this article is to discuss some of the techniques that make the buying of stock an error.
Buying Calls, a Lower Cost Option
When stock is purchased, the investor puts up 100% of the purchase price, or 50% in a margin account and pays interest on the debit or loan balance. And an investor should only buy stock if the security is expected to rise immediately and dramatically. If the stock rises 15%, from 50 to 57 ½ for example, there is...
Remember the article called Our Jack - the trader who should be a loser, but wasn’t and who should have been more profitable, but didn’t care a jot? Well, I bumped into Jack the other day which was a happy coincidence because I’d been reading a fierce argument on Trade2Win about whether Technical Analysis (TA) ‘worked’ or not. I knew Jack used TA, so I was anxious to hear his views.
"Works", laughed Jack, “It’s just a tool, you know, which just as much ‘works’ as Alexandros’s hammer and chisel did in sculpting the Venus de Milo. No, dear boy, it’s you and me that ‘works’ not the tool.”
I thought that sounded somewhat fanciful so I asked Jack how he used TA as a tool. “I use it to make assumptions about what price might do,” he said...
Introduction
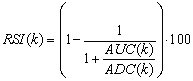
In his 1978 book “New Concepts in Technical Trading Systems” J. Welles Wilder Jr. presented several methods and trading techniques which became classic. In that book Mr., Wilder introduced one of the most widely used technical oscillators today: The Relative Strength Index (RSI for short). Nowadays all kinds of technical analysis software offer the RSI as a build-in oscillator.
This is an enhanced and extended version of my article "Dissecting the RSI" which first appeared in the Technical Analyst publication and later in the Hispatrading magazine.
The actual rsi formula
According to Welles Wilder, the RSI of k periods is defined as:
where AUC(k) is the (2k-1) exponential moving average of UC and ADC(k) is the...
During my time on the floor of the Chicago Mercantile Exchange, I noticed many things that helped shape my thought process and strategy that I still employ today. I started on a very busy trading desk right next to the trading pits and my job was to facilitate institutional order flow. One of the many things I noticed was that most of the trading action happened very early in the day. Furthermore, institutional profits and retail trader losses happened at that same time, very early in the day. I realized that most of the time, when an institution was buying, there was a retail sell order on the other side of that trade and vice versa when the institution was selling, it would be to a retail buy order. This was clear insight into the...
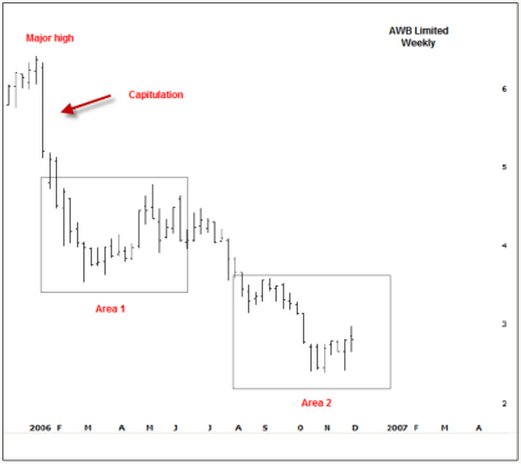
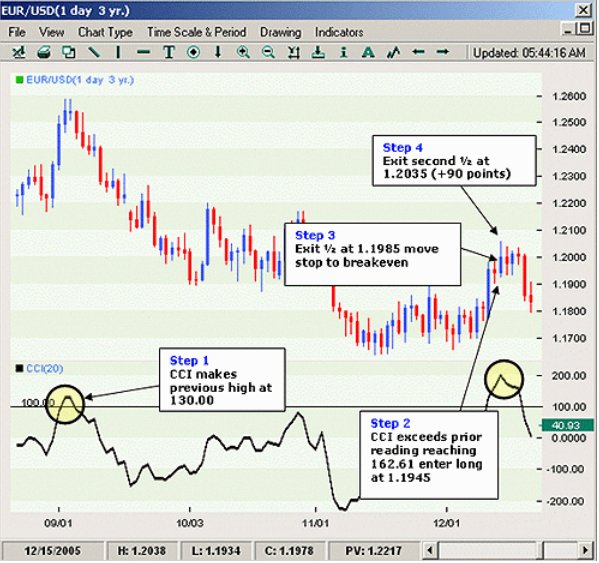
In part 1, I discussed two examples of how and why volume can show the changing face of supply and demand. When the order of supply and demand is change we will get a change in market direction, sometimes a significant change in trend or otherwise some degree of retracement of the prior move. We will now continue on from that discussion and show larger periods of transition which can lead to quite substantial turning points in the major trends. These can be easy to identify, but do require some patience. If you did not read the prior article it would now be worth reviewing that before going on.
Let’s firstly take a look at AWB Limited.
Since early 2006, the price of AWB had been in a downward spiral. The story that eventually came...
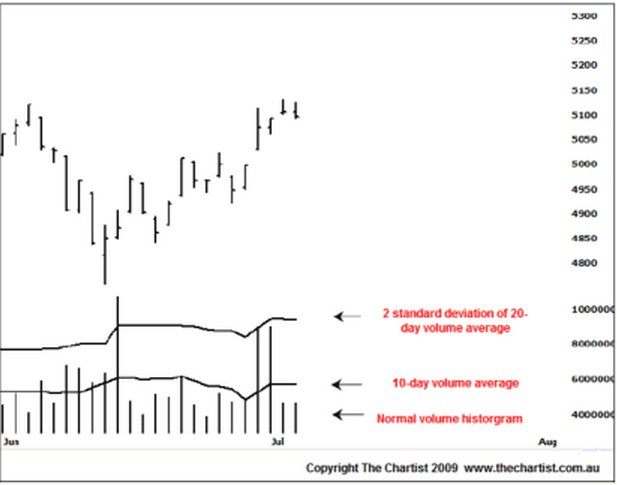
The power of correct volume analysis cannot be overlooked. Unfortunately the ability to read volume correctly is not readily discussed or freely available. Off-the-cuff remarks such as, “increased volume on advances is bullish and increased volume on declines is bearish” are bantered around but that’s as far as it goes. The correct use and application of volume can make for some quite startling insights into price action, especially when one is swing trading or leaning against support and resistance points or zones of confluence.
I set up my charts with a couple of extra volume measures. I use a normal volume histogram that can be found with almost all software packages. However, if there is a larger volume spike skewing the ability to...
It’s common knowledge that no market moves in one direction for an extended period without ‘pulling back’. There are many methods of analysis that try to make sense of these moves and counter-moves, these methods mostly rely on price data alone to guess the start and/or end point of a pullback. In this section, we will look at the liquidity model and how liquidity makes pullbacks inevitable. This isn’t an exercise in market theory; this knowledge will help you jump on board moves at the right time. It is not easy to sell into a rising market but if you understand the liquidity model, you will understand that at times, the market is rising because of a lack of sell side liquidity and NOT because buyers are jumping into the market.
In...
So you’ve probably read many blogs, forums, websites, books in which you are now in a sublime state of happiness in regards to trading the financial markets?
Perhaps you’re an optimistic individual and honestly believe you can double your money in the financial markets? Yes you probably could. Some traders enjoy muted levels of volatility and some just can’t get enough of high volatility environments. What does it matter? Whatever tickles your fancy, one thing is for certain – You will lose money trading the financial markets.
If you can’t handle that then please look away from trading now and find yourself another hobby.
Of course the area of trading is subjective but no doubt trading will give you a losing trade, perhaps even 15...
Most traders are reluctant to buy breakouts, for fear of being the last one to the party before prices reverse with a vengeance. So, how can they learn to trade breakouts confidently and successfully? The "do the right thing" setup is designed to deal with just such a predicament. It tells the trader to buy or sell when most ingrained lessons are against doing so. Furthermore, it puts the trader on the right side of the trend, at the times when many other traders are trying to fade the price action. Read on as we cover this strategy and show you some examples of how it can be used.
Do the Right Thing
In the "do the right thing" strategy, the capitulation of top and bottom pickers in the face of a massive buildup of momentum, forces a...
Day trading involves isolating the current trend from market noise and then capitalizing on that trend through well-timed entries and profit taking. These factors play a crucial role in managing potential profit expectations and risk. Trading has many challenges, but by sticking to certain guidelines success is more likely. Since the market always moves in waves, on all time frames, rules can be created for exploiting this phenomenon. The following five rules will help traders find high profit potential, low risk, intra-day trades.
1. Trade only with the current intra-day trend
Trading with the trend allows for low risk entries and high profit potential if the trend continues. Intra-day trends do not continue indefinitely, reversals do...
It is no secret that various people or bodies within the financial services industry will say or write whatever will sell the products, rather than what is actually true and correct. For this reason, buyers may be more inclined to rely on what they think is hard evidence – in the form of statistics and charts. Regrettably, one can lie with these too.
In 1954, Darell Huff wrote a classic book titled "How To Lie With Statistics," and a German professor by the name of Walter Krämer has had enormous success with a similar book with the same title, except in German "So Lügt Man Mit Statistik" (revised edition, Piper Verlag, 2011). The charts below are also from the book.
In this article, we will see that it is possible to present financial...
Many widely accepted financial models are built around the premise that investors should expect higher returns if they are willing to accept more risk. However, will investing in a portfolio of risky stocks really help increase your investment returns over time? The answer may surprise you. Read on to learn about what is being dubbed the "low-volatility anomaly," why it exists, and what we can learn from it.
The Low Down on Low-Volatility Stocks
If the modern portfolio theory holds true, a portfolio of risky, highly-volatile stocks should have higher returns than a portfolio of safer, less-volatile stocks. However, stock market researchers are discovering that this may not always be the case. A March 2010 study by Malcolm Baker...
Merriam-Webster's Dictionary defines greed as simply, "... a selfish and excessive desire for more of something (as money) than is needed." Greed is often referenced as one of the main contributors to trading loss. Greed mangles the mind by distracting the trader from what matters most in the trade, which is quite frankly, to protect your capital by prudent planning and following rules. It also distorts your judgment regarding high probability strategies and effective follow-through. Additionally, it is the other side of the fear coin; that is, greed can arguably be thought of as a fear of not having "enough."
Of course, having enough is a purely subjective notion, but for the reasonable person, someone who wants more, more, more, as...
When traders lose money, they often attribute the problem to a lapse of discipline. Such a lack of consistency, however, is actually the result of many different problems--not the cause. Traders lose discipline with trading for the same reasons that dieters lose discipline with dieting or people getting in shape lose discipline with exercise. Quite simply, our moods, needs, and mind states of the moment tend to overwhelm our longer-range intentions. We pursue short-term pleasures (and avoid short-term discomfort) at the expense of longer-term rewards.
Here are some common reasons why traders (and most other human beings!) fall short of being fully intentional:
Environmental distractions and boredom cause a lack of focus - All of...
Trading is hard work. Becoming a profitable trader is even harder. So how can traders move from average to successful? I’ve found the best way to help those completely new to trading is to explain the amount of time and dedication required to become a profitable trader with sports analogies. For instance, in baseball if it’s the first time you experience a 100mph fast ball, you’re going to swing and miss. But if you’re dedicated, work hard and practice, you’ll be able to anticipate the 100mph pitch and knock it out of the park. The most successful athletes work hard and constantly seek out ways to improve their performance, and those same principles apply to successful traders.
As a trader with more than 10 years of experience on the...
One of the charting differences between Equities and Futures is that some Futures trade for almost 24 hours per day. Once Equities stop trading at 16:00 EST, the last price that a trader sees on their chart is usually the closing price. The next morning when the market opens at 9:30 EST and the price is higher or lower than the previous closing price, then the trader effectively has a gap opening.
Before electronic and 24 hour trading came to the Futures markets, we were able to do the same thing and be within one or two price ticks of the actual closing price. Now, we have different trading sessions to contend with. In a recent article, I wrote about these two different sessions:
Regular Trading Hours (RTH) – This session is always...
As we end 2011 the Eurozone debt crisis has taken centre stage. Even for the most hardened technical trader it has been difficult to ignore the fundamental noise emanating from Brussels.
This reached fever pitch after the EU summit on 8-9th December was deemed a massive failure. So as we enter a New Year, traders who want to keep their profits need to get used to fusing fundamental and technical analysis when they trade the markets.
For example, EURUSD dipped below 1.30 on 14th December. This was a huge move since it was the lowest level for the single currency for 11 months. 1.30 was like the Rubicon for the FX market – it was considered a point of no return. Not only was it of major technical importance but it also had fundamental...
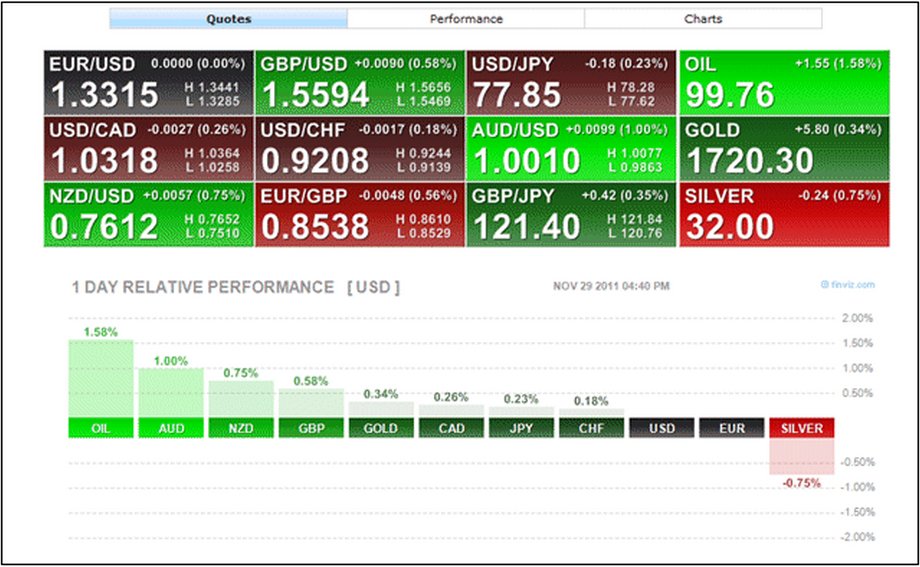
There are many reasons why I enjoy teaching students how to trade the financial markets of the world, ranging from the satisfaction I obviously get from helping others, to knowing that I am helping people to protect the capital they worked so hard for in the first place, and also when I discover something new for myself! That's right; I also learn new things not only from my students, but also from researching and explaining ideas and topics in the teaching environment. This very week I have been teaching and have been focusing on the most effective way to screen for equities to swing and position trade. I was showing the guys in the classroom how to use a great website called Finviz to screen for their stocks to trade, when I noticed...
Why Point & Figure Charts?
Point & Figure (P&F) charts are one of the simplest and clearest ways to determining the best time to buy and sell shares. The P&F system represents one of the oldest approaches to share market trading. This method takes the technical analysts approach while monitoring supply and demand for each share and the charts are designed for long-term trading so that the time and cost of trading shares is minimal.
How are Point & Figure Charts Constructed?
In P&F charts both axis are dependent on price rather than one being based on price and the other on date. The key unit in a P&F chart is the point, or unit of price. The point size may change in value along the y-axis to provide consistent and relative price...
There are two prices that are critical for any investor to know: the current price of the investment he or she owns, or plans to own, and its future selling price. Despite this, investors are constantly reviewing past pricing history and using it to influence their future investment decisions. Some investors won't buy a stock or index that has risen too sharply, because they assume that it's due for a correction, while other investors avoid a falling stock, because they fear that it will continue to deteriorate.
Does academic evidence support these types of predictions, based on recent pricing? In this article, we'll look at four different views of the market and learn more about the associated academic research that supports each...
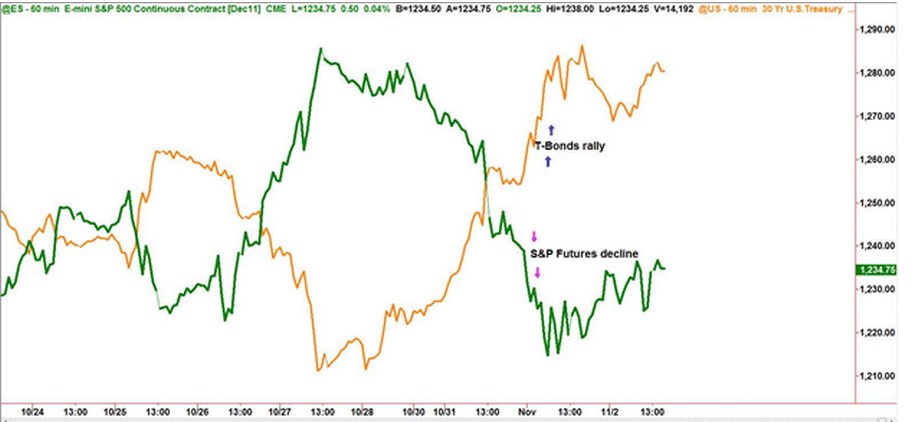
One asset category that is not very well understood is what we refer to in the business as the credit markets. In the futures market, these encompass all debt instruments such as U.S. Treasury Bills, Notes, and Bonds, and are not limited to derivatives of debt issued by the U.S. treasury. The German debt market can also be traded here through most futures brokers on the Eurex exchange. These derivative instruments come with funny names like Schatz, Boble, and Buxl, and finally, the Bund. The different names in all debt instruments are there simply to differentiate the short, medium, and long term maturity dates.
These particular European markets are nice to know about, but for those of us in the U.S., they're not as important as say...