swingin' the ftse: 2009

Ok. I thought I'd better show my face and and admit that selling into strength this morning didn't go down too well-

The warning did come before the opening, though, with a sharp rise in the early hours, before the open. I did try a short on what turned out to be the first pullback of a bull run, but I only lost 5 points. Personally, I thought that the averages told me more on direction than an S&R line would have.

Still, everyone to his own on methodology
 
Personally, I thought that the averages told me more on direction than an S&R line would have.
Still, everyone to his own on methodology
As far as I'm aware - S&R lines don't tell the trader anything about market direction? If your understanding is otherwise - please enlighten me!
 
As far as I'm aware - S&R lines don't tell the trader anything about market direction? If your understanding is otherwise - please enlighten me!

:D You do keep on ! :D

All I'm trying to do is insist that they don't for the benefit of those who think that they are some kind of useful signal because, if they don't indicate direction for me........:whistling
 
:D You do keep on ! :D
:D. . . Just commenting on YOUR post Split'! :D
:All I'm trying to do is insist that they don't for the benefit of those who think that they are some kind of useful signal because, if they don't indicate direction for me........:whistling
And all I'm trying to do is to find out who thinks they're a useful signal of market direction and how they use them for this purpose? It's a genuine question because I really don't know. If you can't help me or don't want to - that's fine - but perhaps you would be kind enough to point me in the direction of someone who might be willing to answer the question.
 
I can't help you, Tim. If I was certain, I'd be glad to. All the trader needs are two things,

(1) a reference point based on a certain pattern. If he is correct in what he does a given number of times, enough to make him profitable, then he is on to a winning strategy. That is the edge that he has and each one of us is different in our makeup, in some way, so as to make it almost impossible to pass the secret on to another.

(2) The ability to accept an incorrect trade and cut it, as soon as possible.

I use averages and trendlines. To say that they are better than S&R is absurd, as is to say the contrary. I know that I push my method, but that is only a form of ego, as is yours because, in some form we want to be seen to be successful traders. Unless we wish to prove our performance by posting it there is no other way to do it. I don't want to do that and I don't blame others for not wanting to, either.

All we can post are ideas, in the sincere hope that someone else may catch on and adapt it to their own style.

That's how I see things.
 
Last edited:
Perhaps I misunderstood or misinterpreted your post. To me, it inferred that some traders use (or attempt to use) S&R lines as a means of determining market direction. I hoped to learn more about how they try and use them for this purpose - nothing more.
It appears I made a mistake, so, as you were . . .
 
S&R
you boys sound like pros, so i may be out my depth here.

S&R to me looks like a potential brick wall, where price could bounce off.
Its not a trend following indicator. Its potential future price areas based on past performance and based on peoples memory of the stock price. Its a target for the price so to speak. Its trying to pigeon hole the price playing field.

But thats horizontal lines.

I believe theres several types of sup/res techniques.
MA's can act as support resistance.
Trend price channels/ trend lines can act as S&R
So some of these can suggest market direction, no? or a target for the price, should it continue in present direction.....

sorry i havent read this discussion properly...but splitlink makes some nice commentary on this page.

I feel that this is going off topic. A stack of stuff has been posted on these threads about this and it can go on and on. You have to decide what you prefer and go with that. Try asking on "First Steps" or" General Trading Chat". Alternatively, go to "Message for FT traders" thread, post 4444, look at the chart and ask yourself where you think the direction is going.

BTW, I'm not a pro, just a retired guy with an interest in trading and I get it wrong, fairly often.
 
Last edited:
Perhaps I misunderstood or misinterpreted your post. To me, it inferred that some traders use (or attempt to use) S&R lines as a means of determining market direction. I hoped to learn more about how they try and use them for this purpose - nothing more.
It appears I made a mistake, so, as you were . . .


http://www.trade2win.com/boards/uk-indices/49208-swingin-ftse-2009-a-41.html#post807256

covered it from here if anyone really interested

I use S & R as a means of determining market direction as I have previously stated

S & R zones are a fact imvho ~ so are an important part of trend


"Hi Andy,
Judging by your last post, it's obvious that I've caused you offence, for which I apologize unreservedly and I assure you was not my intention. As the 'debate' about trendlines Vs S&R lines has clearly swayed into personal territory, I don't think anything useful will be served by my attempting to address your comments, as experience tells me that such action tends to inflame a situation rather than to diffuse it. So, let's call it a day shall we?"
:love:


"Hi tim,
Judging by your last post, it's obvious that I've caused you offence, for which I apologize unreservedly and I assure you was not my intention. As the 'debate' about trendlines Vs S&R lines has clearly swayed into personal territory, I don't think anything useful will be served by my attempting to address your comments, as experience tells me that such action tends to inflame a situation rather than to diffuse it. So, let's call it a day shall we?"
:love:

I refer to posts on mr charts thread also


as per Splits many many posts & advice = each must decide for themselves - test ideas themselves & determine their own truth


later

Andy
 
"Alternatively, go to "Message for FT traders" thread, post 4444, look at the chart and ask yourself where you think the direction is going."

sorry chap, i cant find this, not sure where to look.
Tried searching, got so many pages of results.
 
thanks.

Im not sure why you mentioned this chart.

Theres no support or resistance on it.
Golden cross suggests price is going up.
And the 7MA is sloping up.

I don't use S&R lines very much, there are so many of them that each trader has to put his own in. In any case, they are not exact entry signals but zones which are very elastic. By the time you were deciding on Golden Crosses and 7 avs, I was out of the market because, in late morning through to the Dow open, there is a whipsaw period that I try to avoid. That chart was meant to illustrate what a trend is and how I use averages to enter. There, really, is nothing misterious about them. All one needs is what God has given us all---a pair of eyes.
 
Interesting times boys 'n' girls . . .
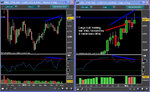
Attached is a weekly (left) and daily (right) candlestick chart. IMO, the index is at the top of its trading range that was established in late 2008. I'm rather loathed to mention S&R as it's something of a taboo subject in this part of the world but, that said, I ask subscribers to the thread to consider the possibility that the index is at or near a potential zone of resistance around the 4,700 mark (horizontal bloo line on both charts).

Here's my take on this week's price action.
Monday printed a large bull candle which, briefly, stuck its head above the 4,700 parapet. Tuesday and Wednesday printed two inside bars (IB's). Today was especially interesting as, potentially, there was a breakout of both the 4,700 resistance level and Monday's HB. Certainly, for the second time this week, price poked its head above the parapet and, also for a second time, it didn't much like what it saw. The result? The index closes below . . .
1. Yesterday's high.
2. The resistance level of 4,700 (for a second time).
3. The high of the HB, i.e. back 'inside' the HB.
This confluence of failed breakout to the upside from the HB and through the 4,700 resistance level is very bearish indeed, IMO. I don't actively trade the index however, if I did, I'd be placing a stop sell oder upon the breach of yesterday's low. For those that need further convincing that a move to the upside isn't looking good, slap on an indicator that shows convergence / divergence. In this case (sorry it's not labeled), is RSI (set to Rivalland's preferred setting of 5 periods) and, as can clearly be seen, there's some negative divergence taking place in some pretty oversold territory. As always, the U.S. will, to a greater or lesser extent, dictate how all this plays out. But, from my perspective, it all looks very bearish indeed, Cue a sharp rise up tomorrow!
:cheesy:
Tim.
 

Attachments

  • FTSE_IB_Breakout_06_08_9.jpg
    FTSE_IB_Breakout_06_08_9.jpg
    123.9 KB · Views: 145
I don't use S&R lines very much, there are so many of them that each trader has to put his own in. In any case, they are not exact entry signals but zones which are very elastic. By the time you were deciding on Golden Crosses and 7 avs, I was out of the market because, in late morning through to the Dow open, there is a whipsaw period that I try to avoid. That chart was meant to illustrate what a trend is and how I use averages to enter. There, really, is nothing misterious about them. All one needs is what God has given us all---a pair of eyes.

late morning around 12pm to 2.30p, the whipsaw?
but the chart doesnt look like a trend example... it just looks like up and down movement.
How you use averages to enter? oh...so you enter/exit/add to a position when the price crosses the moving average?
you added to the SHORT, when it retraced back up... looks risky.
And you closed when the price crossed over the MA....

Please comment on my reading of the chart.

So youre using the 7MA price crossovers to make the signals?

cheers.
 
Yes Tim, this all looks like the end of a riotous party, RSI having retrieved its coat from the spare room and called a cab days ago. The noise was disturbing for those nice Nikkei's next door and they have decided to sell up overnight and take a break down south for a few weeks. Although the crowd from HSBC and the Barclay's wanted to party on, the Lloyds called it a night and left quietly already: guess I'll have to walk home again.
 
Inspired by Jon's recent study of the swing signals track record over the last year, I thought I'd have a look back at some signals I watch out for. Many people, from before Street Smarts and since, have said some of these are high probability trades. But hwvave they researche dthat on the FTSE100 and recently?

I have done a quick look back at 66 months of the FTSE to April. Had a look first at Key Reversals - found 11 Longs (9 winners) and 54 Shorts (38 winners). 9/11 is pretty good, but its a small sample and 11 signals in 5 1/2 years is hardly exciting. 41/65 overall doesn't seem to me to be particularly 'high' probability.

Then Whiplash signals - 138 signals, 48 Long, 30 winners, 90 Short, 60 winners: 65% win rate overall again does not seem that impressive. From quick visual assessment, many of the price moves post-signal seemed very minor and 1-3 days duration only.

Price/14EMA cross-over, moderated to comply with trend as indicated by the 50EMA, had a rubbish win rate at 46%, though some of these signals occurred immediately before very significant moves lasting weeks or months.

Its striking that a widely rubbished MA cross-over method has just the same overall win rate as allegedly high probability signals. Its starting to look to me as if it might be a viable strategy to just jump in to any newly established trend using the nightly close on News at Ten and just get on with it from there.

To get the best out of a trend following ma's, use the bars for pullback entries. Whipsaws are a serious problem with this method and I am always trying to figure when I'm getting into one. In morning trading, if I get a good run I let it go as long as possible, then, as soon as I the lunchtime crowd loses interest I close and I leave it until the next day. Intra-day traders could come back with the lunchtime crowd just before the Dow opens. Whipsaws can come at any time, of course, but lunchtime might be a time to avoid. Nothing is written in stone, of course!
 
.....I'd be placing a stop sell oder upon the breach of yesterday's low. For those that need further convincing that a move to the upside isn't looking good, slap on an indicator that shows convergence / divergence. In this case (sorry it's not labeled), is RSI (set to Rivalland's preferred setting of 5 periods) and, as can clearly be seen, there's some negative divergence taking place in some pretty oversold territory. As always, the U.S. will, to a greater or lesser extent, dictate how all this plays out. But, from my perspective, it all looks very bearish indeed, Cue a sharp rise up tomorrow!
:cheesy:
Tim.

Thanks for sharing this Timsk.....and a good call on the rise today! <heh>.
Still think a sell under Wednesday's low would be in order? I'd be interested in hearing your take on things....
 
I've just been posting to someone who opened a trade on Thursday evening at 4718, which I criticised but he had the guts to hold on through yesterday morning, where it touched the Aug 5th low, but hung on to it . I'm fed up with saying what I did but I hope that some may be getting the idea.

For Monday, things do not look good for bulls, even though the index is above the famous 4700 line. However, nothing can be done until the open, so I am keeping my options open.
 
Top