swingin' the ftse: 2009

Thanks Tom. A trader who ran a course I attended a numbers of years ago used to use a 22 day average as it is the average number of trading days in a month. Each to their own I suppose.
As always, I guess it's a case of finding something that works for you as an individual.
 
mmm, do the institutions use stops?
Hi Jon,
I take your point re. pension funds and the like, but I didn't have them in mind when I made that comment. I was referring to institutional day and swing traders and, yes, it's my belief they use stops much like us mortals do. If I may throw your question back at you, why wouldn't they use stops? (Again, not pension funds and the like, I accept your point about them entirely.)
Tim.
 
The fall in the banks last autumn showed they are willing to drop even their most core holdings if it looks bad enough and barclays seemingly selling their position out from underneath them didnt help
 
Hi Jon,
I take your point re. pension funds and the like, but I didn't have them in mind when I made that comment. I was referring to institutional day and swing traders and, yes, it's my belief they use stops much like us mortals do. If I may throw your question back at you, why wouldn't they use stops? (Again, not pension funds and the like, I accept your point about them entirely.)
Tim.

Tim

Guys like Nick Leeson you mean?:)

Bit tongue in cheek, I know, but with some of the massive trading losses bandied about you've got to wonder!!

good trading

jon
 
Hi Mr.G - Its true there are about 22 trading days per month, but that's not a basis that's needed for a MA. The best basis is, as you suggest, finding one that suits your trading style. So do you want 5 signals a month from a 14EMA or 5 a year from a 40EMA?
(When I say signal, I mean in the widest sense, as a single bit of TA data, not necessarily a buy/sell - the notion of using MAs to generate buys and sells is enough to start a war in some TA circles, and you never know who's listening).
 
(When I say signal, I mean in the widest sense, as a single bit of TA data, not necessarily a buy/sell - the notion of using MAs to generate buys and sells is enough to start a war in some TA circles, and you never know who's listening).

Thanks Tom.

I know that Stanzione fella alledges that one of his systems (that's made about a gazillion bucks, apparently :rolleyes:) only uses MAs to generate signals....
 
I know this is a FTSE thread but as there is a lot of expertise on here, particulary around Rivalland's methodology.....

Looking at the NDX (Nas 100) I'm seeing yesterday as the 3rd down day after the high of Aug 4. Am I interpreting the rules correctly? Any advice gratefully received.
 
I know this is a FTSE thread but as there is a lot of expertise on here, particulary around Rivalland's methodology.....

Looking at the NDX (Nas 100) I'm seeing yesterday as the 3rd down day after the high of Aug 4. Am I interpreting the rules correctly? Any advice gratefully received.


Not on the chart I'm looking at, MrG.

Down day = lower high, lower low. In it's "purest" form you're looking for 3 down days in succession after a high. Rivalland does allow for an interuption to that sequence (an up day after the second down day, for example) and more than 3 down days, but there will always be at least 3 lower lows and lower highs. You need to be a bit careful with the interuptions though.

Hope this helps

good trading

jon

Thanks Jon. A lower high and lower low than the previous day? Or the previous x days? 10th was a LL and LH than 9th but both 9 & 10 didn't meet the rule when compared to the 6th.

Perhaps the correct interpretation is that 5th and 6th meet the LL/LH rule vs the 4th but as the 7th has a HH & HL compared to the 6th the first two corrective days are obliterated.

This stuff isn't currently leaping off of the chart at me, hence the questions.
 
Hi Mr.G - Vince Stanzione is a bit of a conundrum. why does a successful trader need to sell a successful system? All he needs to do is run it and watch the £'s roll in. I don't doubt that he has made money trading: and he's certainly an aggressive and successful marketeer/salesman. And most people would agree that a trend-following system (and MA-generated signals will do for this) will work as long as you keep losses small and quick and hopefully turn the occasional big win. I'd still like to hear from a satisfied Stanzione student but his aggressive sales techniques do not invalidate the MA approach - they just make me shudder a bit.
 
Thanks Jon. A lower high and lower low than the previous day? Or the previous x days? 10th was a LL and LH than 9th but both 9 & 10 didn't meet the rule when compared to the 6th.

Perhaps the correct interpretation is that 5th and 6th meet the LL/LH rule vs the 4th but as the 7th has a HH & HL compared to the 6th the first two corrective days are obliterated.

This stuff isn't currently leaping off of the chart at me, hence the questions.

Looks like, to me anyway :|, that the Nasdaq had it's 3rd down day yesterday.
 
Looks like, to me anyway :|, that the Nasdaq had it's 3rd down day yesterday.

yup :)

That makes it a potential swing low, so we assume a trend continuation if it's high goes which is confirmed if price then goes on to make a new high for the uptrend.

good trading

jon
 
Anyone else still having problems with ProRealTime? No volume for Monday and yesterday's price bar is a mess!
:(
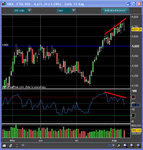
Anyway, not withstanding these discrepancies, the basic story remains the same: price is overcooked. Next stop: test of support at 4,500?
I've just been talking to a LTBH investor friend of mine who pays close attention to Warren Buffet's activities. According to my friend, he's pulled out of equities and gone into bonds. It'll be interesting to see if this affects sentiment in the equity market in the U.S. later on today.
Tim.
 

Attachments

  • FTSE_Test_4,500.jpg
    FTSE_Test_4,500.jpg
    93.8 KB · Views: 147
Anyone else still having problems with ProRealTime? No volume for Monday and yesterday's price bar is a mess!
:(
Anyway, not withstanding these discrepancies, the basic story remains the same: price is overcooked. Next stop: test of support at 4,500?
I've just been talking to a LTBH investor friend of mine who pays close attention to Warren Buffet's activities. According to my friend, he's pulled out of equities and gone into bonds. It'll be interesting to see if this affects sentiment in the equity market in the U.S. later on today.
Tim.

Tim - yes on the PRT q. I've been e-mailing on this every day and they have been making the changes. Mailed them again this morning on yesterday's numbers.

I saw the Warren Buffet story earlier in the week. Interesting piece in today's Lex column in the FT about dividend cuts.
 
Tim - yes on the PRT q. I've been e-mailing on this every day and they have been making the changes. Mailed them again this morning on yesterday's numbers.
Thanks Mr. G - glad it's not just me!
As a free resource, I think PRT is fantastic, I'm really impressed. An occasional glitch in data can be forgiven - especially as it's free. That said, how difficult can it be to get accurate OHLC plus volume data on the FTSE? It really takes the icing off the cake. The (very nice) guys 'n' gels at ShareScope must be lovin' this . . .

Agreed. As a side point, any idea where they get their volume numbers from? Given there is no consolidated tape, unlike the US, if it is only LSE volume they would be missing a chunk. Maybe it's not an issue if you are only looking for trends and averages but would be if you are looking for absolute numbers or are trying to compare recent data to numbers going back a couple of years.
 
http://www.investorsintelligence.com/x/marketdataindex.html

select instrument
p&f chart default loads
select bar, candle or line
select volume
click edit next to it and you get 3 check boxs appear

= free chart with volume data for ftse etc


did notice tims charts appeared a bit out regards volume, could have been chart squish due to time period loaded

free fut volume for ftse (wk day only)

CLICK HERE TO VIEW FREE PRICES & CHARTS

select Liffe then fut chart adjust settings for volume


later

Andy
 
p&f charts

thanks Jon
 

Attachments

  • ftse 200pt.bmp
    1.3 MB · Views: 138
  • ftse 100pt.bmp
    1.3 MB · Views: 127
  • ftse 50pt.bmp
    1.3 MB · Views: 126
Agreed. As a side point, any idea where they get their volume numbers from? Given there is no consolidated tape, unlike the US, if it is only LSE volume they would be missing a chunk. Maybe it's not an issue if you are only looking for trends and averages but would be if you are looking for absolute numbers or are trying to compare recent data to numbers going back a couple of years.

Update to this:

PRT have said that:

"In the case of indices, there is not an official volume figure because indices cannot be traded. I see there is not intraday volume for the 10th, I will write to the data team to see if it can be recovered.

As I mentioned to you before, this is not like volume information for stocks because the ftse index and other indices cannot be traded.* This is a measure based on stocks trading and calculated by our data supplier."
 
Top