You are using an out of date browser. It may not display this or other websites correctly.
You should upgrade or use an alternative browser.
You should upgrade or use an alternative browser.
barjon
Legendary member
- Messages
- 10,752
- Likes
- 1,863
Dow closes positive but only after somebody starts buying in the last 10, minutes and drives it from -20 to +18. A naked example of the US Government manipulating another positive close? Where's dr.blix? This can't be institutions sweeping up knocked-down stocks at a discount, the market is up 11% from 2 weeks ago.
But this surely tells us something. If the prospect of even a modest -20 Dow points close off the top of such a strong rally triggers a buy programme, the US is clearly convinced that the market is about to absolutely tank, and the future hangs in the balance: it seems like just 20pts and 10 minutes separated the US from disaster tonight.
How long can the US Government keep this up? Another day? A week? Maybe, but then what? I look to open shorts at the first signal.
Not sure I buy that, Tom. A few hundred points reaction after such a strong rise wouldn't spook many so I can't see what's in it for USG at the moment. In any event i would have thought they would step in to counter-act any selling and there seemed precious little of that given the low volume that Geo refers to.
ftse seems nervous to go much higher today so far, but holding 4600 and no attempt to close the opening gap. All pretty positive and I'm not looking to ditch long yet. We'll see.
good trading
jon
Geofract
Experienced member
- Messages
- 1,483
- Likes
- 112
Well it would be quite something if we put in another up day. That would be 12 straight up days!
I'll take it on the chin if that happens, and accept that I was wrong. I do have a H1 bias change to the downside from yesterday, but waiting for possible Key reversal would have been a stronger signal.
Btw, thanks for sharing your signals Tom.
I'll take it on the chin if that happens, and accept that I was wrong. I do have a H1 bias change to the downside from yesterday, but waiting for possible Key reversal would have been a stronger signal.
Btw, thanks for sharing your signals Tom.
I do admit Jon neither can I see what's in it for the USG in propping up the market by 20-30 points at a time. I can't even say for sure it is the USG manipulating the Dow. But somebody is behaving strangely, buying companies I am told have poor earnings at top price and I take it that whoever they are they see this as ground they dearly wish to hold onto. Which makes me think I should get int the queue to grab some if they have to pull out.
It also nicely fits with Sun T'zu, attack where your enemy cannot defend. Or as some US Admiral said, hit them where they ain't.
It also nicely fits with Sun T'zu, attack where your enemy cannot defend. Or as some US Admiral said, hit them where they ain't.
barjon
Legendary member
- Messages
- 10,752
- Likes
- 1,863
good goin' guys 😀
Came home to find myself stopped out of today's (loss) and the roller. Still going to favour long for the longer term stuff and a nice retracement keeping above 4400 or so would be dandy.
For the day stuff - powder dry for the moment. 4hour and below all pointing down, but it'll depend on DOW. If it keeps on going then maybe 4500 will be as difficult nut to crack on the way down as it was on the way up.
FTSE turned real weak against dow before mid-day and finished around 25 points lower than if it had just followed the DOW 1 point for 2. Looks like those pulling the FTSE strings expect more DOW downside, but the FTSE bounce is likely to be pretty vigorous if DOW doesn't comply. As usual we'll see.
good trading
jon
timsk
Legendary member
- Messages
- 8,869
- Likes
- 3,574
Hi Tom,My short blown away yesterday. At least I got out on time. Waiting for the next opportunity. Or Godot, whichever comes sooner.
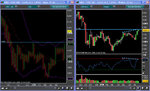
Well, your next opportunity may well come next week. Attached is a weekly candle chart plus a daily P&F chart (box size: 1, reversal amount: 3%).
The latter is of interest because it shows the Bolly bands as being flat and price nearing the upper deviation. Price tends to 'ride the bands' (e.g. the falls last year) following a Bolly band 'squeeze' which results from a period of low volatility. There's no evidence of a squeeze now and, at times when the bands are flat, there's a tendency for price to revert to the mean - the centre dashed line on the chart.
The candle chart includes RSI, with Rivalland's preferred setting of just 5 periods. The upper red line is at 80 and the indicator looks as if it may be turning back down from its current oversold reading of 75.8. What's of particular interest though is the negative deviation between price and RSI (bloo dotted line).
Doubtless, all eyes will be on the U.S. today. If the markets there are unable to build on recent gains and start to sell off, we can expect the FTSE to follow suit. IF this happens, an obvious short entry would be on the breach below this week's low around 4,500. This would also be the point (more or less) where a new column of red 'O's will print on the P&F chart with a centre line target of 4,100.
Tim.
Attachments
I hope you're proven correct tiom, I couldn't bear to be going long so high off the lows of the current trrend, unless we have a severe retracement and recover up from a higher swing low.
I was going to dig out my Dorsey on P&F charts this weekend but perhaps you / others can advise and save me the search - my short entry this week was founded on swing trade set-up but on the P&F chart the sell signal occurred well above the bullish support line (emanating from the year's low). A well known P&F rule is to ignore sell signals above the bullish support line. Obeying this would have kept me out, and saved me some money, all well and good - but your suggested short entry point, again looking sensible on swing grounds, contravenes the P&F rule.
OK, TA signals are only based on probability and obeying/breaking a rule cannot guarantee success/failure. I assume we have to regard a short entry above the support as permissible, but high risk?
timsk
Legendary member
- Messages
- 8,869
- Likes
- 3,574
Hi Tom,I was going to dig out my Dorsey on P&F charts this weekend but perhaps you / others can advise and save me the search - my short entry this week was founded on swing trade set-up but on the P&F chart the sell signal occurred well above the bullish support line (emanating from the year's low). A well known P&F rule is to ignore sell signals above the bullish support line. Obeying this would have kept me out, and saved me some money, all well and good - but your suggested short entry point, again looking sensible on swing grounds, contravenes the P&F rule.
It's a long time since I've read Du Plessis - so I don't recall his thinking on bullish support and bearish resistance lines. That said, I expect he'd confirm the view you've expressed. My own view is that they are indeed of value when there's a discernable trend within the timeframe one's trading. I agree that the March lows could well prove to be a turning point and the start of a new uptrend. However, I would want to see a clear breach of resistance at 4,680 (bloo line on both my charts) to create a new higher high before entertaining the idea of an uptrend. As things stand, to my way of thinking, we're still in a rangebound market, allowing traders to afford equal weight to P&F buy and sell signals (and any other signals come to that) as and when they occur. But, that's just my personal take on the situation. If you do dig out your copy of Dorsey - please report back your findings!
😉
Tim.
barjon
Legendary member
- Messages
- 10,752
- Likes
- 1,863
warning: this is from a prorealtime chart which has had a lot of suspect data over the last few months although they say it has been corrected. I've not bothered checking it.
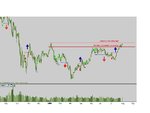
New weekly close high but still a bit to go to knock out the high reached in January. So far as three bar swingers are concerned the latest up move of nearly 500 points has come without any retracement and they will not have been in unless they play the swingtrend change as well as 3 bar retracements.
Thought you might be interested to see about a years worth of 3 bar swings.
7 buy signals
- 2 failed
- 2 break even (reached 1:1 so stoploss moved to b/e)
- 1 better than 2:1
- 2 good @ 600/700 points (you'd have been stopped out of one at b/e if you didn't have a re-entry strategy)
3 sell signals
- 2 b/e (reached 1:1 but you'd have been lucky to escape on one)
- 1 better than 2:1
So a pretty poor period overall. Would have done better if you'd also played the swingtrend changes but that depends or where you would have put your stoplosses. No wonder we've been focussing on intraday 🙂
good trading
jon
Attachments
Good round-up Jon, thank you. Not a great year and certainly confirms we needed to have a higher magnification narrower time-frame approach standing by: people will have seen me using whiplash, key reversal, 2-day retracements and the like with admittedly mixed results, others have their own approaches too.
Of course, the lower magnification approach would have worked pretty well too - buy as soon as we close above the 200EMA: if still long, stop and reverse into a short when we close below it. I have not been doing this.
Shorter-term, I see the Jan resistance as well, and reinforced by an isolated high Nov 08 close. We are comfortably above the Year To Date level though, something I pay no attention to as a short-term trader but I hear the break of this barrier brings in additional long-term money. This might have assisted the recent rise since the breach on the 20th, and maybe there is more to come?
Of course, the lower magnification approach would have worked pretty well too - buy as soon as we close above the 200EMA: if still long, stop and reverse into a short when we close below it. I have not been doing this.
But maybe I should be. I know, I know, I know - MA-based entry signals are a route to disaster. But trend-following is a route to success. And MAs are just indicators that follow trends. There must be a simple way to do this as long as losses can be cut early and I intend to look into it.
As promised, Thomas Dorsey on support and resistance lines on P&F charts -
'For long-term investors, a stock is always bullish if it is trading above the Bullish Support Line. Conversely, a stock is always bearish if it trades below the Bearish Resistance Line. That is for long-term investors. Traders are much more flexible and find the truth somewhere in between most of the time.'
And later, on trading tactics using the catapult pattern -
'Long-term investors will only stop out on violations of the trend line. Traders will take every signal regardless of the trend line.'
So shorting near the Bullish Support line is not out the window, it just carries a high risk of getting in short just when long-term people are looking to buy.
timsk
Legendary member
- Messages
- 8,869
- Likes
- 3,574
Phew, that's a relief Tom, I was worried for a minute that I'd said something that contravenes Dorsey's view about P&F!
I love P&F charts but, just like any other graphical representation of market behaviour - they make the whole business of trading look deceptively simple. Yes, I know it IS simple, but it sure as hell ain't easy! What am I twittering on about? Here's a simple example. Take any P&F chart of any instrument that's trending. It doesn't much matter how you define trend for the purposes of this exercise. MA's, trendlines, bullish / bearish support lines - or just eyeballing the chart. Any or all of the above will do. Now, assuming an uptrend, and a 3 box reversal P&F chart, here's what you do . . .
1. Wait for a pullback, i.e. a column of (red) 'O's to print.
2. The column of 'O's should be at least 2/3 the length of the preceding column of (green) 'X's.
3. The column of (red) 'O's must not breach the low of the previous column of (red) 'O's (thereby creating a double bottom sell signal).
4. Set a stop buy order at the level that a reversal will print a new column of three (green) 'X's.
5. Place an if triggered stop order 4 boxes lower at the point price would print a fresh column of (red) 'O's.
6. As always, profit targets are much harder and discretionary based. One suggestion would be to close half the position when price approaches or kisses the upper deviation of a 2.0 standard Bolly Band.
7. Rinse and repeat on the next reversal up.
That's it. That's your ideal entry point on a P&F chart of any up trending instrument.
Look at any trending chart and you'll see that you can make a shed load of wonga if you can execute this strategy. So what's the hitch? The hitch is that you only know when a reversal prints after the event at the end of the day. In practice, I've never been able to make it work. But, looking at a P&F chart, it looks SOOOO easy! And they say that charts don't lie . . .
:whistling
Have a good weekend all!
Tim.
P.S. This post is intended as a bit of light hearted weekend banter, fuelled by a glass of wine. It's not to be taken that seriously!
Last edited:
Cheers Tim - simple but not easy sums up the whole game of trading. But I do think the simpler you can keep it , the less hard it will be. Your point on not being able to recognise a reversal until after the event is well made - nobody can. For me, there is no trick here - the implication is that you have to be in every move, as nobody can really judge which will succeed, the real skill lies in getting out of the losers early, not deciding which trades will be winners.
But maybe I should be. I know, I know, I know - MA-based entry signals are a route to disaster. But trend-following is a route to success. And MAs are just indicators that follow trends. There must be a simple way to do this as long as losses can be cut early and I intend to look into it.
My method is to have a favourite TF. Define the trend on that to your satisfaction. Take a note of the area in which you expect the turn to occur and go down to a lower TF making sure that you use the turn point on the higher trend deciding TF as your reference. The lower you go the more sensitive the signal. Swing traders don't like this but my risk is more acceptable to me.
The fact that you have a direction is a great plus for using averages, IMO.
For instance the 4 hour FT is showing the start of a downtrend. Tomorrow, that is probably the way I shall go, ie, sell into strength, but I will not decide for sure until the day because things start to happen from 0600 and the chart may be different at the open.
These are just thoughts, rambling on as it were.
Cheers Split - Its certainly the case that if intending to use a trend-followng system, as I try to do, you have to know which way the trend is pointing. The inexperienced think this is so blindingly obvious that they often completely overlook the question.
So the question is valid and I see the reasoning behind your focusing down to a smaller TF. But I find intra-day TA difficult and distrust it, partly because intra-day TFs are random and notional only and not based on real market behaviour, as opposed to a daily TF, which is bounded by closed periods, or the weekly TF, bounded by weekends. Nobody in the market has to review their positions because 11:47am is approaching, but everybody will be looking at their positions at 4:25pm on Friday and all for the same reason. So I trust daily H, L and C when they suggest potential S/R, but have real difficulties with morning H, L or C as opposed to middle-day H, L or C or afternoon H, L or C.
I am more tempted by the longer TF view as per Tim's message (and Rivalland's suggestions) and look at weekly TA to back up my daily signals.
Similar threads
- Replies
- 26
- Views
- 9K