swingin' the ftse: 2009

Thanks for the input on indicators everyone.

Personally I find them misleading, and have removed them all from my charts. Equally I am open to the possibility that I just don't know how to read them. But for now I will focus on learning the price action patterns, as this is a weak part of my trading.

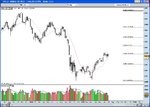
Regards NDX weekly hanging man line - yes it's reversal pattern, but then the chart still holds a HH HL pattern - I wasn't suggest shorting as is. I just wanted to make Andy aware of when a pin is a pin, and when it becomes something else.

Geo
 
careful geo, that hanging man is actually a hammer - hammerish really since it's not a particularly good example - since it's the last candle (as yet) in a downward reaction from the 1512 highs - a swing low as andy says. As such you can see it as a reversal pattern in the sense of maybe halting the reaction preceding a continuation of the current uptrend. Thus it's suggesting a long opportunity.

It remains valid as a potential swing low until it's low (1413) goes and secondary confirmation of trend continuation will come with a close above it's high (1484).

good trading

jon

Thanks Jon,

FWIW how I understand the pattern is as follows. The week before last on NDX developed a potential hammer, and only potential - confirmation of a hammer would be a break and close above the wick. The following week we have a bearish engulfing bar (engulfing the real body of the potential hammer), which, for now negates the possibility of a hammer. But does for now confirm a hanging man line. However, if next week we have a bullish engulfing candle, the potential hammer is confirmed, and what was a reversal pattern will be clearly negated - and for me that would be the confirmation to go long. As of now, given the HH HL pattern, then Flat is probably best, which is where Andy is at.

I wanted to point this out, because as we all know there is a lot of talk about trading pins and hammers, which is useful stuff for sure. But it's important IMHO to understand when a candles meaning changes, even if only for a brief period of time. And of course I'm not suggesting the whole rally collapses either (though I wish it would).

This is what I've read about in my candle charting book... if it's all guff, then maybe I should burn it :confused:

Thanks for the PM Jon - No probs. All the above IMHO btw.

p.s. On the chart 7 weeks ago a potential hammer was formed, but then became an upside down hanging man line, due to the engulfing bullish bar that followed. That's my understanding anyway.
 

Attachments

  • ndx_weekly.jpg
    ndx_weekly.jpg
    178.1 KB · Views: 140
geo

At the risk of teaching granny to suck eggs.......:)

hanging man and shooting star occur at the top of a move and their high will normally represent the current high for the move. They are negated by their highs being taken out.

hammer and inverted hammer occur at the bottom of a move and their low will normally represent the current low for the move. They are negated by their lows being taken out.

I would not regard last weeks engulfing candle as negating hammer 2 (see chart) since the assumed support from that hammer is not yet threatened.

Some 1 or 2 bar swingers and candle followers will already be long from hammer 1 or hammer 2 (see chart) and underwater at the moment if they are only working from the weekly.

The earlier candle you mention has an inverted hammer look, but I would be extremely doubtful about it because it did not mark the low for the move.

good trading

jon
 

Attachments

  • NASDAQ-100 INDEX.png
    NASDAQ-100 INDEX.png
    8.8 KB · Views: 165
fascinating stuff, not really looked into this type of stuff yet, apologies for this newbie question, but are these candle principles directly transferable to bars?

i couldn't imagine that they weren't, but confirmation of this would be great!

props, once again for your clear and aesthetically pleasing charts jon.
 
Thanks Jon,

Ok, I think I see now. If I understood:

The hanging man can't be such, because it is already proved to not be the top of the move. And the hammer can only be negated when the shadow is engulfed.

In your opinion, is there no point in waiting for a close above the hammer for confirmation, just a break above will do?

Geo
 
fascinating stuff, not really looked into this type of stuff yet, apologies for this newbie question, but are these candle principles directly transferable to bars?

i couldn't imagine that they weren't, but confirmation of this would be great!

props, once again for your clear and aesthetically pleasing charts jon.

It should be fine DB. It's just a bit easier to see in Candles, but it's still the same OHLC values used to create a bar or a candle.

I'm sure Jon will say if not.
 
yeah thought so mate, still the same opening - closing info on both...bit of a daft question i know, just that i'd remembered a question once asked of martin pring re candle and bar analysis and i just thought i'd remembered him saying they could poss be different. (prob got that wrong though!)...

anyhoo, thanks for keeping me straight :)
 
Last edited:
Thanks Jon,

Ok, I think I see now. If I understood:

The hanging man can't be such, because it is already proved to not be the top of the move. And the hammer can only be negated when the shadow is engulfed.

In your opinion, is there no point in waiting for a close above the hammer for confirmation, just a break above will do?

Geo


geo

er, yes - hanging man comes at the top of a move. Both hanging man and hammer are potential reversal candles and their extremes (shadow/wick) - high extreme in the case of hanging man and low extreme in the case of hammer - represent assumed resistance (hanging man) and support (hammer) levels. Thus they are negated if those extremes are taken out (not necessarily by an engulfing candle) and the move continues. ie: there is no reversal at that point. Don't forget it doesn't necessarily pan out like that - you're just using the pattern to make assumptions and find that "reason to enter".

So far as waiting for closing confirmation before entry goes, it depends on your style. The very bold don't wait, the more cautious do. I vary because I like to see a bit of momentum behind the break - when I will take it - rather than it just staggering through - when I won't. I will go to a lower time frame and look for some break out pattern sign there.

fwiw I've never found hanging man (at the top) or it's equivalent inverted hammer at the bottom very reliable, but my eyes light up when potential swing high is marked by a shooting star or a potential swing low by a hammer. I take a double position then.

Hope all this helps and hasn't confused :rolleyes:

good trading

jon
 
Thanks jon for taking the time answer all my questions, and correcting me too!

Geo
 
Last edited:
........and here's my all time favourite FTSE hammer which gave the end of the bear market in 2003 on the 4 weekly :D
 

Attachments

  • FTSE 100.png
    FTSE 100.png
    9.2 KB · Views: 166
I am short from 4235.

I closed for +52 earlier today. My entry was too late I think. Looking for new entry around 4260 if it happens.

S&P broke swing low of 23rd June today - sufficient for confirmation of change of trend (in Rivallands terms at least)? Or do we need to break the Swing low of 21st May?
 
I got out with profit but late so not enough really. Then went short again on what I thought was just a bounce (not waiting for a proper signal) so now in the red. Sloppy.

I think we could see 4260 very very soon. Today forms a 20d low on the FTSE and, as the strong US close makes upward move tomorrow likely, offers a Turtle Soup long entry tomorrow only at the previous 20d low, 4213 from 25/06, with stop at today's low, 4172. I've never played one of these I think so this will be interesting.
 
nice to see a month chart Jon

ftse volume low on actual yesterday

ftse volume higher on futures

range looked normal but majority was a quick mark down of open 30 min, most of the session spent in a 25 point range !

NDX still out above old range highs, volume yesterday was fair / printed a pin bar"ry thing

if the high goes you have a swing low and continuation of trend in place on the strong one

SPX holds range lows imo

shake fake squirt and go time :)
 
Last edited:
NDX

"if the high goes you have a swing low and continuation of trend in place on the strong one"

and if it does"nt :)


will sit on hands and see reaction from the old roof location


if it proves to be asbestos will attempt short via intra day

1414 - 1426 with Stop at 1438

1st Target 1390 - 1378 Stop to BE and possible add if opportunity presents

2nd Target 1354 1342


Andy
 
DJ broke May lows. S&P meets May lows. NDX breaks June swing low. Dax continues beyond swing low of 23rd June. In Rivallands terms I'm sure this now counts as a change of trend for all Indices.

FT fails at 4240 - I not sure we will see 4260 again soon - but never say never. Will have to await new entry.

Did you keep your short open from yesterday Tom?
 
Last edited:
DJ broke May lows. S&P meets May lows. NDX breaks June swing low. Dax continues beyond swing low of 23rd June. In Rivallands terms I'm sure this now counts as a change of trend for all Indices.

FT fails at 4240 - I not sure we will see 4260 again soon - but never say never. Will have to await new entry.

Did you keep your short open Tom?

Keep a close eye on your positions, particularly if holding overnight. We're now entering earnings reporting season in the US. Many of the heavyweights release their figures after the NY bell. To be honest, I'd rather be holding short FTSE overnight than long.
 
Had two shorts when week started, closed first for profit, other was on a false bounce and closed for loss, slightly down across the pair. Then damn it all went long today as we made Turtle Soup pattern: limited risk involved (thought long positions better be less than half my usual size at present) so annoying rather than damaging but never imagined US would be quite so negative today. Still, tomorrow's another day.
 
Top