ymonly said:
Is anyone posting on these forums capable of teaching us how to find the right side of resolution before the hinges /sringboards are resolved? doesn't that seem a bit late entry as I would like to be able to get in on right side of move before the move occurs once I get up to speed? excuse my novice questions please....
OK, I'll have a shot at this. The best clues are in the order flow and market delta. It is my firm belief that very few people posting on these forums pay sufficient attention to the the order book in stock index futures. There is price and volume which shows what has happened, and much is made of this. But the book is largely ignored and too often dismissed with remarks about flipping, spoofing and whatever. But the book is the single source of data that actually leads the market - the trick is to interpret it - something I could never do by staring at a price ladder DOM. All the available software tools are, IMHO, inadequate.
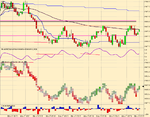
Leaving aside the rant, I'll get to the point. Attached is a chart of todays DAX - each bar 200 contracts wide. We can see in the premarket price is stuck in a range of 8-10 points just above 6900. Call it a hinge or whatever.
On the candlestick plot, horizontal lines are various MP levels, pivot points, and the previous day's VWAP. The blue bands are the current day's market profile developing upper and lower value areas, the black band is the VWAP.
The second from top plot is a smoothed representation of the ratio of contracts at ask in the book to total number of contracts in the book (5 levels on each side using an IB data feed).
The third from top plot is something like a MarketDelta footprint plot, but each price level is coloured by an algorithm that combines book data and the difference of contracts traded at bid and contracts traded at ask.
The bottom plot shows contracts traded at ask minus contracts traded at bid.
There certainly seems to be a good hint here as to which way the market will break which it did right on the opening of the cash market.
Lots of other useful stuff on this chart too. Notice how the down move is terminated when the order book delta manages to get above the half way point (0.5).
The order book shows the supply half of the supply/demand pair. Volume and in particular the at bid/at ask delta shows the demand. As the downmove begins the supply of longs (contracts offered in the book) dries up - the participants are not offering because they think price is going to fall - if they want to sell, they are submitting marketable orders and these are not visible in the book. The supply of shorts (bids) exceeds that of longs. But the demand for shorts exceeds supply for a period and the price falls. As demand for shorts is finally exhausted, the supply of shorts reduces and supply of longs starts to increase. Why ? Because the markets exist to facilitate trade. Markets move towards liquidity. This pattern plays out over and over again.


