Retracement strategy development

jo

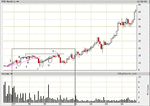
I think you'd be going some to be thinking of a long entry around the Z point. If you were going to be in, you'd have been in earlier. The X to 2 retracement stopped at around the fib50% which was pretty coincident with the resistance becomes support support line. A fairly safe long entry as the price lifted above the high of the last down bar of the retracement with a stop under that bar's low.(the 3 bar swing I prattled on about earlier would have given an entry here)

As the price reached Z it is around fib50% of the X to 2 down move and I'd have tightened my stop in case it turned round here and the X to 2 retracement became instead the first leg of a reversal downtrend - I certainly wouldn't be thinking of entering long at this point.

That's my take anyway - the more expert may have other ideas!!

good trading

jon
 
JumpOff said:
I've taken the liberty of modifying one of the charts that dbphoenix has posted earlier - removing what we now know to be a big move to the upside. The right edge of it illustrates an area that I find most problematic.

Thanks,
JO

JO, I agree that the right edge can be problematic.
But that is the whole reason for this thread. And also the reason for then "rectangles" and "bases" files that db was kind enough to post.

What I or anybody but yourself would do, is not that important, because each of our "risk" threshold is different and has a great deal to do with how well we understand our setup.

As far as where you might enter, and exit, that has to do with what you determined is the most likely price action to happen after your entry. And you cannot do that until you know what it is that your entering into.

Again, we all find the right side to be problematic to one degree or another, but we are trying to make it easier on ourselves by studying the P/V action, TL action and so forth.

What do the last two P/V bars tell you? compared to the last 6 or so P/V bars?
Perhaps if you attempt to try and explain what is going on with price and volume up to your "z" point, that'll help with your understanding.
 
Erie is correct that a Stage 2 TL implies a slowing of momentum. Therefore, the eventual rest that price takes is not surprising.

But a few notes on Tune's comments:

In June '97 price breaks above the previous swing high but there is no follow through.

I wouldn't say there's no follow-through. Like JO, you're allowing your knowledge of the future to color your analysis of the chart. Price, after all, rises 25% above the level of the last swing high. That's not too bad. What it does after that, and what you do about what it does, has nothing to do with your interpretation of its behavior during that rise since the future has not at that point transpired.

A little thrust?

Quite possibly. If you look at the daily, there's very little volume after the first day, so the move isn't attracting a following.

it closes below the walk up trendline

I suggest you consider this a demand line rather than a "trend" line since to consider price as trending within a trading range pretty much defeats the purpose of defining trend in the first place.

Plenty more stops triggered

What evidence do you have to support this statement?

it only came down when thumped hard with sizeable shakeouts.

Again, it's best to look at the daily chart when testing a hypothesis regarding shakeouts. Remember we're talking about fall of '98 and January '00, and since the latter doesn't break S, there's no reason to suspect that it's a shakeout.

Re Sulong:

3 bars later P test the first line of potential support

Glad you noticed this. Many people would think that price was finding S at the TL. But since TLs don't provide S, price is finding S at the last swing high (on the monthly chart). You also noted the likely reason for the high volume stall in April '99 (see note above regarding shakeouts and thrusts).

Before we leave this, a couple of things. First, find the retracement(s) on the monthly chart prior to January '01. Second, find those points at which trend reverses, also on the monthly chart, also prior to January '01. Also, tell me what you see in that daily chart I posted, June '96 to March '97, particularly with regard to "retracements".
 
Last edited:
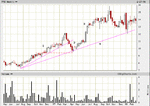
Monthly.
On the “RET” side of things, I see 4 of them in that zone.
A and C are major RET’s and B and D are minor RET’s. Once price failed to move higher at E,
The major trend was halted.

On the reversal side of things, I don’t see a reversal, only a decelerating trend between TL 1 and TL 4.
And then a halted trend, but no reversal.

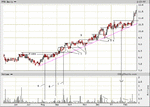
Daily.
Beginning with the BO to a new high.
At “A” there is a first test of the lower portion of the prior R zone. The following 7 –8 bars imply little interest from sellers at this point.
At point “B”, price again test the R zone, but this time the upper part of the zone, with a little more interest from participants. The following 2 –3 bars show absolutely no interest from sellers at this level. (Where we might expect to find sellers if there were any)

The points between B and C is a low volume BO. The area at “C” is the first RET, where participants finely woke up to what was happening.
From there price gives us a stairstep type action with mild reactions, until the mid. of Dec.where price makes a steeper and deeper “RET”, which might be a little unsettling at the time, but the price never violates the last reaction low.
The end of Dec. through the mid of Feb. price consolidated in a range, before advancing off into the right side of the chart.

That high volume day in the middle of that last range, I would imagine scared the long johns right off a number of buyers, to the delight of someone.

I count 6 “RET’s”
 

Attachments

  • PFB00d.gif
    PFB00d.gif
    16.8 KB · Views: 263
  • PFB00b.gif
    PFB00b.gif
    18.8 KB · Views: 291
sulong said:
Monthly.
On the “RET” side of things, I see 4 of them in that zone.
A and C are major RET’s and B and D are minor RET’s.

Let's pause here and break this down. How are you defining these as RETs?
 
dbphoenix said:
Let's pause here and break this down. How are you defining these as RETs?

The RET's are where the price retraces some of its prior price movement, to a varying degree..
A minor RET can happen just like a minor S/R level can happen.
As long as price makes a higher high following a downward move that dont take out the previous low, we have a successful RET.
Out of the ones I listed on the monthly chart, "D" was the most difficult to define, as the price at the time was at a R zone, But I determined that the shakeout bar was a reset of the trend.
 
sulong said:
The RET's are where the price retraces some of its prior price movement, to a varying degree..

So any movement that is counter to the prior movement is a RET?
 
dbphoenix said:
So any movement that is counter to the prior movement is a RET?

In a word yes, but for it to be tradeable it needs to have a lower volume to it than the volume of the primary move.
( Within the context of "trend")
 
Your win:loss ratio may not be satisfactory with that particular definition.
 
dbphoenix said:
This is, of course, the week between Christmas and New Year's. If volume dried up any further, it would be non-existent. So don't draw any important conclusions from volume over the past ten days.

Temporary interruption of regularly scheduled programing....

When you first posted this, I thought to myself " what do we care about holidays?"
Meaning what ever the reason for a dry up in volume and a contraction of daily range, the same principals apply.
The range expansion today seems to reinforce the thought of "who cares about the reason".

Just an observation for what it's worth.
 
dbphoenix said:
Plenty more stops triggered

What evidence do you have to support this statement?

QUOTE]

Thank you for your comments. I see exactly what you mean.
What evidence? None. There was no point in saying that.

I am not at all sure of how many rets there are on the monthly chart, my estimate is three.
I don't see a reversal.

Daily later.

Edit: I am not implying that the trendlines are providing the support. That's one thing I do know. My concern is whether or not 3 is a ret or a rev. If I had not drawn a TL I would be thinking rev. I'm a bit confused here. Not least because I have never bothered much with sloping trendlines before. I always concentrate on the horizontal lines.
 

Attachments

  • ret problem.gif
    ret problem.gif
    13 KB · Views: 230
Last edited:
sulong said:
Temporary interruption of regularly scheduled programing....

When you first posted this, I thought to myself " what do we care about holidays?"
Meaning what ever the reason for a dry up in volume and a contraction of daily range, the same principals apply.
The range expansion today seems to reinforce the thought of "who cares about the reason".

Just an observation for what it's worth.

You seem to be implying that one has something to do with the other.

In any case, the same principles do not apply. Volume which "dries up" because nobody is playing does not carry the same import.
 
Last edited:
tune said:
My concern is whether or not 3 is a ret or a rev. If I had not drawn a TL I would be thinking rev. I'm a bit confused here. .

No problem. I was under the impression that a more exact definition of RET had been reached, but apparently there is more work to be done in that regard. Perhaps a review of the posts made so far?
 
dbphoenix said:
So any movement that is counter to the prior movement is a RET?

I can only define one retracement on the monthly chart. The up / down patterns within the channel are not yet part of the uptrend. There is also a sideways channel / rectangle near the top of the chart. I have marked the retracment with a blue line and added my comments.
JO
 

Attachments

  • PFB_monthly_retracements.gif
    PFB_monthly_retracements.gif
    28.6 KB · Views: 277
I forgot to add that all of my observations above were based upon price alone. Although I know volume is an important piece of the puzzle, I don't feel qualified to discuss those aspects of this chart.
JO
 
Whether a given retracement is successful would seem to have a lot to do with the surrounding "landscape". ie. (in terms of a uptrend and then retracement) enthusiasm and number of buyers on the way up, how many prior stages has this advance already been through, how vertical the rise was and hence level of potential support offered on the way down, whether there was a climatic top or just a lack of buying interest, how heavy the selling was on the retracement, were there any gaps trapping current holders, has price fallen far enough to scare the holders out, is it "churning". Perhaps it's worthwhile defining a retracement with some of these things in mind?

Regards,
Frank
 
tune said:
Edit: I am not implying that the trendlines are providing the support. That's one thing I do know. My concern is whether or not 3 is a ret or a rev. If I had not drawn a TL I would be thinking rev. I'm a bit confused here. Not least because I have never bothered much with sloping trendlines before. I always concentrate on the horizontal lines.

Leaving the subject of retracements and reversals for a moment, a comment on your trendlines.

What you read in Trendlines may or may not be helpful to you, particularly if you can distinguish between up and down (don't laugh). However, these TLs do serve several functions, not necessary perhaps, but useful.

First, they can show increases or decreases in momentum.

Second, since they define trend, they also aid in detecting trend change and trend reversal (there's no need to go into this in any more detail since you have the material at hand).

As regards your chart, the first TL, which corresponds to my Stage 2, is correct since there is a new high after the retracement. However, the next TL is not legitimate since there is no new high. Rather the failure to make a new high defines the trend change and gives you the upper limit to what looks at the time to become a trading range (this trading range is confirmed, if one needs further confirmation, by the failure to make a lower low at your "3").

Your third TL is technically correct since price does eventually make a higher high. However, though technically correct, it is essentially useless since it does not reflect the "new" trend (again, this is in the material you already have). In this case, there are more important issues on which to focus, such as whether or not price can hold above this range. If it can, then fanning the lines again -- only up, this time, rather than down -- may be the appropriate action. But you can't yet know that since you don't know what happens next.

The above is all somewhat off topic, but unless one has a thorough understanding of trend vs trendlessness, I should think it would be next to impossible to understand retracement vs reversal.
 

Attachments

  • tune.gif
    tune.gif
    10.5 KB · Views: 297
I'm confused now. Can the breaking of a trendline actually be called a retracement, or is that in fact a trend reversal? And does a trend reversal actually become a retracement once a lower trend line is established by a new price high? (said in all honesty)
 
frdyr said:
I'm confused now. Can the breaking of a trendline actually be called a retracement, or is that in fact a trend reversal? And does a trend reversal actually become a retracement once a lower trend line is established by a new price high? (said in all honesty)

In a general sense, one can define retracement and reversal however he likes as long as he defines the setup and tests it, which is why, even though all of this is defined in the Practicum, I've left all of it open here.

However, within the context of the definitions I've provided, the breaking of a TL is neither a retracement or a reversal, at least not yet. If you're referring to my reply to tune, that was an outgrowth of an earlier post (#53) having to do with price action before the rectangle is formed. However, we're already up to 80 posts, so I'll repost it here.

There is a trend formed after price leaves the trading range it was in up to September '96 (1). There are two retracements on the way to the swing high in February which we haven't gone into yet, neither of which break the TL, then the more substantial retracement at 2, which does. Price then makes a new high at 3, and a Stage 2 TL can at that point be drawn (4).

As for reversals, again, one can define them however he likes as long as he's willing to test the setup. Otherwise, it's just philosophy. For me, there's no reversal as long as price continues to trend. But no one is required to use my definitions.
 

Attachments

  • PFB00c.gif
    PFB00c.gif
    21.5 KB · Views: 304
Last edited:
Top