OK so:
P = Crossing Point or Price
which is just a lable assigned to P with an 'x' on your diagrams, it doesn't explain the meaning, therefore define what P is please. How is it determined within the bar where the 'x' is?
Also you seem to be making a an assumption/restriction of being long OR short with no other state of being neither long or short, ie. not in the market = waiting for an opportunity.
Mysteron
SHORT ANSWER
P = The crossing point that an indicator (any indicator) switches from long-to-short or from short-to-long. They are idealised diagrams for the purposes only of showing the backtest calculation method, be it FALSEtime, SAFEtime or REALtime.
For the purposes of keeping the backtest calculations simple to start with, remembering that it is primarily for benchmarking only (ie relative performance), the INDE benchmark adopts a pure stop-and-reverse approach so that it is always in the market.
Once this benchmark is set, you can then gauge your chosen indicator/system against the INDE benchmark, hopefully surpassing it.
I'm not at all averse to having times when I'm out the market and no doubt in time I will also backtest long-short-out signals and dual timeframes and compare these against the INDE benchmark.
LONG ANSWER
It may be an idea to take a little step back.
The purpose of the diagrams is to show the action behind the creation of a benchmark, in this case the INDE benchmark. However, to create a benchmark you need to know where INDE formula sits amongst the standard indicators, simply to prove to yourself that your on the right track.
The INDE benchmark is based on pure stop-and-reverse trading, always being in the market - this does not mean that your chosen system has to be stop-and-reverse, but before using it you should first backtest to check that it surpasses the INDE benchmark - and to backtest you first need to reverse calculate your indicator formula to find the exact entry/exit points.
Now, the INDE formula is fairly straightforward to reverse calculate in terms of finding the crossing points because it is built on the accumulation technique (the same applies to any other indicator using the accumulation technique, eg most of Wilder's systems). To clarify, INDE is a 'raw' version of Wilder's Directional Movement System, similar to the Directional Indicators which are the calculations that are used by Wilder to arrive at the ADX.
Several of the standard indicators used in the benchmarking process are however built on moving average techniques which, compared to the accumulation technique, are relatively more difficult to reverse calculate so to find the exact crossing points (P). This is the reason for first identifying with the FALSEtime and SAFEtime scenarios, albeit they do not represent the exact entry/exit points generated by your chosen indicator (remember that the INDE 'indicator' is not put forward to say that it is better than all others, but to give a benchmark or reference point to gauge all others, be they better or not so).
The FALSEtime and SAFEtime (or REALtime) calculations therefore have no sway on the actual entry/exit points, but provide a frame in which all of the benchmarked indicators can be analysed in the first instance. This is a very important point and one often overlooked. If you are backtesting using pre-packaged software with hidden code, how do you know if it's properly representing the REALtime calculation, ie the one which actually happens in 'real life'.
In terms of producing backtest results, FALSEtime provides a wildly overstated expectation of return, and SAFEtime provides an understated expectation of return. In other words, if you gauged the performance of your chosen indicator/system on the back of the FALSEtime calculation then you will be severely disappointed in the outcomes when you come to live trade it. If you gauged the performance of your chosen indicator/system on the back of the SAFEtime calculation then you will be pleasantly surprised that your outcomes surpass your SAFEtime expectations. Remember that your actual entry/exit points are as calculated by your chosen indicator (be it RSI, INDE, moving averages, etc), which is separate to the FALSEtime, SAFEtime and REALtime calculations, which are provided purely to generate backtesting results.
The FALSEtime calculation therefore receives a red cross to indicate it is way off the mark to depend on it as a backtesting method, the SAFEtime one green tick to indicate it has promise, and REALtime two green ticks to indicate that this is the way you need to go, to zero in on and refine as much as possible (ie look to further develop the calculation to reflect trading costs and any other foreseeables that you may come across as you live trade, eg the effect of any 'outside day' movement when trading using a relatively small accumulation factor/lookback period).
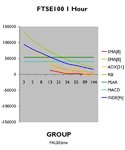
The FALSEtime calculation does however have a saving grace, in that it provides a clearer differentiation of performance between indicators than the SAFEtime calculation. In other words, if you look at the below chart you can see that Wilder's RSI (lime line) provides the most impressive relative performance amongst all the other indicators, including INDE (blue line).

Now, the RSI is one of Wilder's creations and so the accumulation technique is used in its calculation, which lends itself well to REALtime backtesting. Whilst the FALSEtime result is an overstated expectation we do know that the REALtime rankings will be ordered similar, and so this merits further investigation. I'm currently developing this now and looking to release some solid REALtime backtesting results by the end of the year.
No doubt the large financial houses already have this information, which they will have generated many moons ago, but the for retail trader it is long awaited.


