You are using an out of date browser. It may not display this or other websites correctly.
You should upgrade or use an alternative browser.
You should upgrade or use an alternative browser.
tune
Well-known member
- Messages
- 394
- Likes
- 51
dbphoenix said:Also note that the ES and YM did not.
This is interesting.
It has made me notice that during the first half hour of today, (prior to the BO), the ES and the YM both made higher lows but the NQ only achieved level lows.
tune
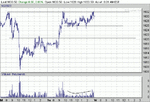
12/29/04
Another dry up in volume yesterday afternoon, with a narrow range.
I see the area between 1632 and 1640 as a major R zone. So I'll be watching for some possible supply to come in to the market in that area, if price goes there first thing this morning.
Other wise, 1626 - 1622 looks to me like a good area to watch for possible support to come in.
We'll see how the first 2 hours go.
Attachments
tune
Well-known member
- Messages
- 394
- Likes
- 51
Thank you for putting this thread together Sulong. I missed most of it at the time due to Christmas duties but have caught up now. It has been very useful to me because it has, indirectly, shown me that I need to do a lot more work before I start getting too carried away with trying to develop strategies and tactics.
I have read the Practicum five times now and am still picking more things up each time. The same is true for the other files. Working through charts bar by bar is doing me a lot of good, although it is by no means second nature. I don't think I am good enough at the basics to warrant moving onto the next stage. I'm quite happy consolidating where I am, so much so that I have sorely missed having a decent volume day to pick over.
I will continue to keep future strategies and tactics in mind but for the time being I think it is best that I concentrate on the observation of and the study of price behaviour. I want to be able to do those Wyckoffian analyses as well as Db does them in the Practicum. When I can do that I will think about the next bit.
tune
dbphoenix
Guest Author
- Messages
- 6,954
- Likes
- 1,266
tune said:for the time being I think it is best that I concentrate on the observation of and the study of price behaviour. I want to be able to do those Wyckoffian analyses as well as Db does them in the Practicum. When I can do that I will think about the next bit.
tune
The best way to learn how to do them is to do them. Studying them and reading about them will take you only so far, and that's not very since there's only so much to say.
As I suggested before, PFB is a good example, and it's practically "by the numbers". Post a three-year weekly chart of it and begin at the left edge. If you don't begin, you'll never make any progress, much less finish.
Later:Changed my mind. Begin at the beginning, which in this case goes back to '97. Beginning with a 3yr chart ignores the fact that 9/11 broke the '00 thru '02 trendline, which makes things trickier.
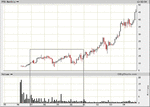
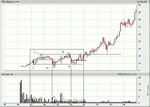
What's happening inside the rectangle? (Sulong, if this is off-topic, I'll start another thread)
Attachments
Last edited:
I've been going over my journal, notes and studies for this last year, and noting my progress and updating my assumptions.
And then I popped open the "Big W" file.
All I could say was wow, look at those "W" symbols, there was 3 different symbols, or 3 variations of the W action.
I'm mentioning this because that is the conclusion I came up with when I updated my studies. But until I did the work, I never noticed the three different "W" symbols in the file before.
I don't know if the variations in the file were intentional or not, but now I've got a little something more to work with.
dbphoenix
Guest Author
- Messages
- 6,954
- Likes
- 1,266
sulong said:I never noticed the three different "W" symbols in the file before.
I don't know if the variations in the file were intentional or not . . .
Yes, they were. An easter egg of sorts. And you're the first person I know of who's noticed. That means you're going to be enormously successful and makes piles of money.
dbphoenix said:The best way to learn how to do them is to do them.
(Sulong, if this is off-topic, I'll start another thread)
No, I think it is very on topic.
Hopefully we'll get participation from a number of readers here. I know I'm working on my own annotations, and will post them when my little house monster allows me the time to finish. (nap time)
JumpOff
1
- Messages
- 702
- Likes
- 14
Here's my take. JOWhat's happening inside the rectangle?
Attachments
Last edited:
dbphoenix
Guest Author
- Messages
- 6,954
- Likes
- 1,266
JumpOff said:Here's my take. JO
You may be right, but you're looking at it in hindsight as a whole, i.e., you don't know that accumulation is taking place -- if it is -- when price enters the area outlined by the rectangle.
Edit: I'm dropping the first two months so that the subsequent volume bars are easier to read.
Attachments
Last edited:
tune
Well-known member
- Messages
- 394
- Likes
- 51
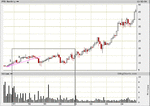
What's happening inside the rectangle?
In June '97 price breaks above the previous swing high but there is no follow through. Instead, a narrow range forms between 13 and 15. One session does break above 15 but it closes back in the range and things continue as if nothing happened. The 13/15 range drags on for a year and then there is a lengthy down bozo on high volume that thumps price back down to 10, which coincidentally, is the level of the previous swing low. As shocking as this bozo might have been to recent buyers it was not a complete surprise because there were four drooping closes beforehand.
There is no follow through to this bozo and the following two bars suggest strong buying pressure as both drag themselves back up and close above the bottom of the bozo. From then on it is a very orderly, narrow barred, walk up back to 15. There is one large volume month in the middle but it does not upset the gradient in any way. Once up at 15 the progress stalls for 3 bars and then there is a spike up with a close above 15. There was not much volume behind it though. A little thrust?
Next bar is the longest down bar since that '98 bozo and it closes below the walk up trendline. Following bar is a hefty bozo on double the recent volume and closes smack on the 10 line. Plenty more stops triggered.
The next four bars successfully test 10 and then there is the first white bozo for 3 years. It's the first sign of free upwards movement and price is quickly back up to 15. Two down bars do follow but they have long tails and don't make it back down to 10. The next bar is another long white candle and we finally have a higher low. This time the sellers didn't bang the price back down.
Over the four year period price spent most of its time in the upper half of the 10/15 range and it only came down when thumped hard with sizeable shakeouts.
The final BO, however, was not a big volume, vertical take off affair. Instead price rose gently on even lower volume. It looks like supply was withdrawn, which would tally up with the white bozos in '00. A couple of parting shots to the downside confirm that R is now S and up price floats.
One of the quietest volume sessions in the whole affair was the month after the first white bozo. (A low volume pullback?) It was also very quiet just before the bull spike in '99 and the first bozo in '98.
dbphoenix
Guest Author
- Messages
- 6,954
- Likes
- 1,266
See? You're better at this than you thought.
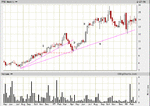
I should have asked that the analysis include the entry into the rectangle since it becomes easier to understand what's going on with the swing high and the test of the swing high and the lower high and so on if one incorporates what came before. It's easy, and I'll get it out of the way myself rather than ask you (or anyone else) to back up.
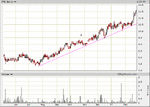
Note in the last chart I posted the little trend that begins in mid-'96, enters the area that I outlined, and continues to Feb '97. This is exploded with a daily chart following. Note the TL (this, as you'll remember, is a Stage 1 TL).
Then there is, yes, a retracement (2). This is successful as it results in a continuation and a higher high (3), which you noted, and after which a new TL can be drawn (4), a Stage 2 TL. Remember from Trendlines what a Stage 2 TL implies?
Attachments
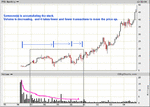
Took a little longer than I thought it would, but nevertheless here it is.
At 1 price makes a low with a doji accompanied by volume larger than that of the preceding bozo volume.
The P / V action leading up to 2 looks promising for a continued move up.
At 2, P makes a hammer type bar (notice the length of the bar) which is cause for concern for long holders, and inticement for shorts.
3 bars later P test the first line of potential support, followed by disinterested V to rise P.
The bozo at 1a, along with the corresponding V suggest exhaustion, the following 2 hammer type bars confirm selling is over for the time being, (shake out?)
From here demand takes the upper hand until we get about half way between 1a and 2a, where a mighty struggle happens (high volume bar), this takes place at a point at the top of 1-bottom of 2.
When we come to 2a, demand is weakened, and it doesn’t take much supply to push price back down.
The decline from 2a to 1b is sharp and steep, more so than the previous decline. And it’s done on less V than the previous decline. (1a)
The 4 bars following 1b indicate a general agreement of price. When price finally rises above that 4-month base, that base proves to be a major support area, where price gets launched on an extended move.
Attachments
frdyr
Newbie
- Messages
- 6
- Likes
- 0
Hi Guys,
I would like to learn more about Wyckoff, his trading techniques and PV analysis. However the reviews on Amazon for the Wyckoff books (Stock Market Technique 1 & 2) indicate they are more a collection of articles and tading maxims. I have also read "How I trade and invest..." and this has very little to do with PV studies. Are there any good Wyckoff resouces you can recommend?
Regards,
Frank
tune
Well-known member
- Messages
- 394
- Likes
- 51
Thank you Sulong and Db. That was enjoyable. If I blend in more volume detail and some trendlines to my stuff I think I will have something half decent.
That was a good exercise for me. If you want to do more work on PFB, or anything else for that matter. Fire away.
tune
That was a good exercise for me. If you want to do more work on PFB, or anything else for that matter. Fire away.
tune
dbphoenix
Guest Author
- Messages
- 6,954
- Likes
- 1,266
tune said:Thank you Sulong and Db. That was enjoyable. If I blend in more volume detail and some trendlines to my stuff I think I will have something half decent.
That was a good exercise for me. If you want to do more work on PFB, or anything else for that matter. Fire away.
tune
We've just started on PFB.
And there is my question on Stage 2 TLs, which nobody has responded to yet . . . 🙂
Last edited:
erierambler
Well-known member
- Messages
- 265
- Likes
- 8
dbphoenix said:We've just started on PFB.
And there is my question on Stage 2 TLs, which nobody has responded to yet . . . 🙂
A stage 2 TL that you have drawn (4) implies a slowing of momentum, giving others a chance to climb aboard the rise in price. Should they climb aboard or not would remain to be seen. In this case they did not.
erie
JumpOff
1
- Messages
- 702
- Likes
- 14
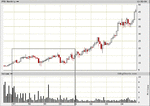
I've taken the liberty of modifying one of the charts that dbphoenix has posted earlier - removing what we now know to be a big move to the upside. The right edge of it illustrates an area that I find most problematic. This looks like a failure to make a new high, yet we have not seen a lower low. Although we know in hindsight that the price shoots up on the next bar, I am at a loss to know what to do at this kind of juncture in real time - and ignorance/prudence/fear causes me to do nothing. (I have removed the stage 2 TL, because I wanted to look at the chart and ask 'would I really have drawn it there yet?')
If you were not already long from shortly after the low at point 2, are there any signals here that would cause you to get off your hands? If you placed a trap to go long if the price goes above Z, the natural place to put a stop would have been slightly below the dotted red line. - but where is the upside? To go long here means that you are assuming that the price will rise above X (otherwise you are entering a trade where the stop loss is twice the size of the expect rise) - but is there any obvious signal that this will happen?
I'd like to apologies for asking such a beginner's question, you'd think by now I might be moving beyond this level. Alas - it is not so. I am still making trades that when analyzed in hindsight had no basis for entry. The most important thing I have yet to learn is to stay out of low probability trades.
Is Z one of those ?
Thanks,
JO
Attachments
Similar threads
- Replies
- 301
- Views
- 52K
- Replies
- 187
- Views
- 41K
- Article
Technical Analysis
How to Trade Forex with Fibonacci Retracement Tools
- Replies
- 1
- Views
- 8K
- Replies
- 11
- Views
- 3K

