Hinges and Springboards

You're all going to despise me.

I freely admit that you're all talking a langauge that I don't understand. I suspect that others reading this thread may also be in the same boat. However, I am intrigued and curious.

I day trade for a living.

I have no other form of income.

I spread bet.

I use (lagging) indicators.

I watch Dax and Dow only. Nothing else.

I have volume on my charts but I don't know how to use it. Sometimes, when I see a rally, and then I get a large volume bar, and then price either stops or retraces, I suspect that that is "stopping volume", i.e. that that bar comprised mostly sellers stopping the price go any higher. However, I don't make any trading decisions based on volume. My trading decisions are based solely on my indicators, and my "feel" for the market, which i have watched for many, many, many days, weeks, and months. All day. Every day. I am aware when my indicators are valid, and when they should be ignored. When they should be ignored I mentally remove them from my chart. E.g. when the market is in a steep trend any momentum indicator should be ignored.

Now, a fact that I'm sure, we will all agree upon, is that the BEST indicator of all is..... PRICE.

Where we differ is the method that we use to predict where PRICE will most likely go in the coming bar(s).

I will consult with the glossary of terms on T2W, because you're using terminology which is alien to me. I hope this thread continues, because, one day, when I understand what you're actually talking about, I may come back to it, and it will enhance my trading ability. Until then I will continue to "lurk" and stand on the sidelines.

Let the abuse commence.
 
bluetipex said:
You're all going to despise me.

I freely admit that you're all talking a langauge that I don't understand. I suspect that others reading this thread may also be in the same boat. However, I am intrigued and curious.

I day trade for a living.

I have no other form of income.

I spread bet.

I use (lagging) indicators.

I watch Dax and Dow only. Nothing else.

I have volume on my charts but I don't know how to use it. Sometimes, when I see a rally, and then I get a large volume bar, and then price either stops or retraces, I suspect that that is "stopping volume", i.e. that that bar comprised mostly sellers stopping the price go any higher. However, I don't make any trading decisions based on volume. My trading decisions are based solely on my indicators, and my "feel" for the market, which i have watched for many, many, many days, weeks, and months. All day. Every day. I am aware when my indicators are valid, and when they should be ignored. When they should be ignored I mentally remove them from my chart. E.g. when the market is in a steep trend any momentum indicator should be ignored.

Now, a fact that I'm sure, we will all agree upon, is that the BEST indicator of all is..... PRICE.

Where we differ is the method that we use to predict where PRICE will most likely go in the coming bar(s).

I will consult with the glossary of terms on T2W, because you're using terminology which is alien to me. I hope this thread continues, because, one day, when I understand what you're actually talking about, I may come back to it, and it will enhance my trading ability. Until then I will continue to "lurk" and stand on the sidelines.

Let the abuse commence.
good post, bluetipex.

there shouldnt be abuse for simply admitting the terms being used are beyond your (and my) current understanding.

the positive point is, that you have a mechanism that seem to work, you have a sense when to use your indicators and when to ignore them (I totally relate to that. I have learnt to trust my signals when market is trending, and ignore when choppy; as with you, thsi comes mostly from experience).

also, you are open-minded enough to accept there may be better ways to trade, which is why we read these theads.

its only irritating when people suggest theirs is the ONLY way to trade, rather than acknowledge there are many different methods (moon cycles included)

hope DBP posts his charts, with the analysis, and at some time makes forward analysis as well. (with entry-points and exits, etc)
 
Welcome

bluetipex said:
You're all going to despise me.

I freely admit that you're all talking a langauge that I don't understand. I suspect that others reading this thread may also be in the same boat. However, I am intrigued and curious.

I day trade for a living.

I have no other form of income.

I spread bet.

I use (lagging) indicators.

I watch Dax and Dow only. Nothing else.

I have volume on my charts but I don't know how to use it. Sometimes, when I see a rally, and then I get a large volume bar, and then price either stops or retraces, I suspect that that is "stopping volume", i.e. that that bar comprised mostly sellers stopping the price go any higher. However, I don't make any trading decisions based on volume. My trading decisions are based solely on my indicators, and my "feel" for the market, which i have watched for many, many, many days, weeks, and months. All day. Every day. I am aware when my indicators are valid, and when they should be ignored. When they should be ignored I mentally remove them from my chart. E.g. when the market is in a steep trend any momentum indicator should be ignored.

Now, a fact that I'm sure, we will all agree upon, is that the BEST indicator of all is..... PRICE.

Where we differ is the method that we use to predict where PRICE will most likely go in the coming bar(s).

I will consult with the glossary of terms on T2W, because you're using terminology which is alien to me. I hope this thread continues, because, one day, when I understand what you're actually talking about, I may come back to it, and it will enhance my trading ability. Until then I will continue to "lurk" and stand on the sidelines.

Let the abuse commence.
Everyone has a way of trading that suits them. If it is profitable then that way of trading is correct for that individual. Some use indicators, equally, some don't. Many people, like yourself, are curious as to the methods of others. Therefore, ignore the abusers since they are an attention seeking minority.
 
No abuse from me, bluetipex!

Hi bluetipex'
I second trendie's comments and would add that far from despising you as you fear, I for one rather envy you! To day trade profitably with a SB account puts you among a very elite group of traders indeed.

As for not understanding the terminology - I don't think this matters especially. Dbp has often made the point (please correct me Dbp if I paraphrase you incorrectly!) that T.A. labels can be personal to each individual trader to the extent that, for example, my understanding and definition of 'trend' may be very different from yours. Such issues would largely be resolved if there was a 'Trading Code' that everyone adhered to in the same way that there is a 'Highway Code' for driving. Alas, there isn't.

Going back to Dbp's opening post; his chart is clearly annotated so that you can follow his thinking even if, say, the term 'springboard' is unfamiliar to you. I'll stick my neck out at this point and try to differentiate Dbp's approach to trading from that of mr. marcus. Suffice to say, this is just my perception which may well be different to everyone elses. Hopefully, it will provide useful feedback for Dbp and mr. m' respectively.

Dbp's focus is on what has happened in the (recent) past and how it relates to what is happening right now. He doesn't much care what happens next and has little or no interest in making predictions about the future. On page 3 of the thread, rainman2 wrote "I thought the point of the SITE is prediction and tactics". Dbp like many other traders, (e.g. Chick Goslin) seeks to make sense of what price is doing now. How this is done, i.e. what tools you elect to use (volume, indicators etc.) doesn't really matter. To make this difficult task easier than it might otherwise be, he has clearly defined patterns of price movement so that everything has a very precise meaning. For example, are you crystal clear in your own mind of the difference between a 'pullback' and a 'retracement'? Dbp will be and, furthermore, he will be able to spot them as the chart prints. This enables him to look at most (any?) chart and assess what is happening. He is not concerned with 'who' moves price - professionals or retail traders - or 'why' price moves in the way it does. His very precise assessment enables him to decide what he will - or won't - do in consequence. This is totally pre-planned and covers all eventualities. In the event that the story on the chart becomes unclear, he response will be to sit on his hands until clarity returns. If and when price moves to trigger one of his set-ups, he will enter a trade. If his set-ups aren't triggered, he doesn't trade, period. No prediction is involved. Once in a trade, tactics - i.e. trade management - then come into play.

mr. marcus has an approach which is very different. Unlike Dbp, he is concerned with 'intent' - the 'why' behind price movement. As I understand it, intent is driven by professionals because the cards are stacked in their favour. They have the deep pockets, unrivalled expertise, level III and state of the art I.T. etc., etc. He attempts to understand the game plan of the pro's and how the 'weak hands' will respond. Weak hands certainly comprise retail traders but may also include other pro's as well. His approach is to get a handle on the dynamic between these two groups which, unlike Dbp, enables him to make predictions of startling accuracy about the future. He has a much harder task in explaining his thinking as his approach to T.A. is from a fresh angle. Also, he is constrained by wanting to make a positive contribution to the boards on the one hand without giving away too much about his modus operandi on the other. Clearly, this is a very tricky balancing act. Once in a trade, as with everyone, trade management comes into play.

Tim.
(Dbp - as this post doesn't relate directly to the subject of your thread, I'm happy to delete it if you want me to)
 
springboards and hinges .......nq intraday same fo r other eminis........market type intraday is either run or chop..and can be both more than once..anything between my signals is non issue.......and my signals never miss the real turn....only 1 signal.....filters the junk between the signals....
 
1 min chart is trap for most, especially beginners.........why would i want 60 events instead of 6 4 or 2 that give me a much clearer story....intraday futures trading is best with mechanical system for the dummies like me......
 
dbphoenix said:
As for the current state of affairs in this chart, traders rejected 5000 last May, then again in July. 4200 was rejected in August and September. This is a wide range, the mean of which was 4600. Price worked the area between 4500 and 4900 for several months, again seeking equilibrium. This equilibrium was broken in February, but traders have now returned to their most recent "comfort zone". This is where they can find trades and reasonable safety. Price may remain here and find balance either side of 4800. Or it may try again to resume the uptrend. The reversals trader who doesn't mind trading tight ranges might trade here. The breakouts/momentum trader will wait for some determined move out of the range, either up or down. But he will not likely be searching for trades in chop.
]
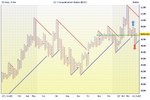
For my money, a P&F chart illustrates all this in a simpler, more visually striking and easily accessible way than any other chart. By their very nature, all P&F charts with bullish support (blue) lines and bearish resistance (red) lines show hinges. The chart is a succession of 'hinges' which resolve either to the up side or to the downside. Within the chart lie many clues as to which of the two outcomes is most likely to prevail.
1. The further price moves away from the most dominant line - the stronger the trend. This is characterised by a succession of double bottom sell signals (in a down trend) or double top buy signals (in an up trend). Since the mid Feb highs around the 5,200 level, there have been 3 double bottom sell signals and only one buy signal. Pressure is clearly being exerted upon the bullish support line. There is a void between price and the bearish resistance line, i.e.no buying pressure being exerted here.
2. The one double top buy signal (blue arrow on chart) offered no follow through at all. The response by sellers was very emphatic, breaking through potential support at 4,275 and generating another double bottom sell signal at 4,700 (red arrow).
3. The equilibrium that Dbp referred to is wonderfully easy to spot on a P&F chart: just count the number of O's and X's! This is illustrated by the green line at 4,750. One could draw it in the row below which has 19 columns filled since October '06, but I've put it where it is (at 18 columns filled) to account for the weighting of the most recent price action. As can easily be seen, price currently resides very near to this equilibrium.
4. For the chart to become more bullish, it must break above resistance at 4,900 to generate a new double top buy signal. Failure to do this, and subsequent pressure on the bullish support line would be very bearish indeed.
Tim.
 

Attachments

  • DJTA_16_03_07.jpg
    DJTA_16_03_07.jpg
    214.5 KB · Views: 302
Last edited:
timsk said:
Hi bluetipex'
I second trendie's comments and would add that far from despising you as you fear, I for one rather envy you! To day trade profitably with a SB account puts you among a very elite group of traders indeed.

As for not understanding the terminology - I don't think this matters especially. Dbp has often made the point (please correct me Dbp if I paraphrase you incorrectly!) that T.A. labels can be personal to each individual trader to the extent that, for example, my understanding and definition of 'trend' may be very different from yours. Such issues would largely be resolved if there was a 'Trading Code' that everyone adhered to in the same way that there is a 'Highway Code' for driving. Alas, there isn't.

Going back to Dbp's opening post; his chart is clearly annotated so that you can follow his thinking even if, say, the term 'springboard' is unfamiliar to you. I'll stick my neck out at this point and try to differentiate Dbp's approach to trading from that of mr. marcus. Suffice to say, this is just my perception which may well be different to everyone elses. Hopefully, it will provide useful feedback for Dbp and mr. m' respectively.

Dbp's focus is on what has happened in the (recent) past and how it relates to what is happening right now. He doesn't much care what happens next and has little or no interest in making predictions about the future. On page 3 of the thread, rainman2 wrote "I thought the point of the SITE is prediction and tactics". Dbp like many other traders, (e.g. Chick Goslin) seeks to make sense of what price is doing now. How this is done, i.e. what tools you elect to use (volume, indicators etc.) doesn't really matter. To make this difficult task easier than it might otherwise be, he has clearly defined patterns of price movement so that everything has a very precise meaning. For example, are you crystal clear in your own mind of the difference between a 'pullback' and a 'retracement'? Dbp will be and, furthermore, he will be able to spot them as the chart prints. This enables him to look at most (any?) chart and assess what is happening. He is not concerned with 'who' moves price - professionals or retail traders - or 'why' price moves in the way it does. His very precise assessment enables him to decide what he will - or won't - do in consequence. This is totally pre-planned and covers all eventualities. In the event that the story on the chart becomes unclear, he response will be to sit on his hands until clarity returns. If and when price moves to trigger one of his set-ups, he will enter a trade. If his set-ups aren't triggered, he doesn't trade, period. No prediction is involved. Once in a trade, tactics - i.e. trade management - then come into play.

mr. marcus has an approach which is very different. Unlike Dbp, he is concerned with 'intent' - the 'why' behind price movement. As I understand it, intent is driven by professionals because the cards are stacked in their favour. They have the deep pockets, unrivalled expertise, level III and state of the art I.T. etc., etc. He attempts to understand the game plan of the pro's and how the 'weak hands' will respond. Weak hands certainly comprise retail traders but may also include other pro's as well. His approach is to get a handle on the dynamic between these two groups which, unlike Dbp, enables him to make predictions of startling accuracy about the future. He has a much harder task in explaining his thinking as his approach to T.A. is from a fresh angle. Also, he is constrained by wanting to make a positive contribution to the boards on the one hand without giving away too much about his modus operandi on the other. Clearly, this is a very tricky balancing act. Once in a trade, as with everyone, trade management comes into play.

Tim.
(Dbp - as this post doesn't relate directly to the subject of your thread, I'm happy to delete it if you want me to)

when trading a setup - aren't we in essence making a prediction of future price direction? If not, then what is the purpose of a setup? Why not just flip a coin?

thanks in advance for clarifying.
 
dbphoenix said:
Where were you looking it up?

Edit: Never mind. The researcher in me had to look for it myself. It's from chapter 10: You now have succeeded in taking a position close to the danger point; that is, close to the lowest levels at which it has been supported, therefore your risk is limited to the minimum. Moreover, the stock is on the springboard for it has oscillated to a dead center, or hinge, at 30 (at M, vertical chart), and appears to have completed preparation for an important advance. Now if volume increases as the stock recovers, you will have a final confirmation of the soundness of your bullish position.

And here's the chart:

attachment.php


Note that price does in fact form a "hinge". When he says that price is "on the springboard", here and elsewhere, he means that price is ready to move, ready to spring. A hinge, therefore, is a springboard. So is the springboard-shaped lateral movement that I pointed out in my first chart (post 1). Price can also be "on the springboard" if price has extended its move past the point of the hinge and moves laterally, like a hinge with its tongue sticking out (price does not have to move by the time the hinge is two-thirds completed; I don't know where that came from). The hinge, however, is a particular type of springboard, one which may be easier to recognize in real time (it is for me, anyway) because of the lower high and higher low. As soon as I see that, I back off.

Db

would you have taken the short then when it broke out at point N, or does the volume have to be more convincing? I see theres quite a bit of support around that area also.
 
Hello DbPhoenix,

Sorry to interrupt this thread, but I've been reading through recent posts with interest as well as other threads about price analysis and wonder whether you have read or have seen a book called Techniques of Tape Reading by Vadym Graifer?? If you know of it would you recommend the material inside?

Once again apologies for interrupting this thread....

Kind Regards,

Chorlton
 
Possible Live Hinge/Springboard?

DBP

If you have a moment could you have a look at this morning's Dax June futures? Very sideways, and there was a large volume spike at 10:37 where the market stopped a small down move. I noticed this but don't know what it means.

I have a theory that the longer the sideways action/consolidation, the bigger the break out move. Given 5 hours of sideways action so far, we could be in for a nice break out.

Does your hinge/springboard strategy apply here right now as I type?

I assume if you were trading this you'd simply wait for the break out up or down, and would have no view which way it would go?

In terms of timing I would probably pay close attention when the US market opens at 1.30pm for the break out move...

If you're busy then please ignore this post.
 
db,

Thank you for your reply earlier.

What do you look for when spotting these in real-time...lower highs + higher lows till price narrows to a consensus ???

And have you found nothing that indicates a higher probability for a breakout either way based on the price action as the hinge is forming ?

Porks.
 
dbp

Am I correct in thinking that in essence there is little difference between a springboard and a hinge? Other than a hinge provides some indication of when it is coming to fruition ie. arrives at the' vanishing point', for want of a better term. Whereas the sprigboard gives no indication of its end until it breaks up or down.

Regards

bracke
 
springboards and hinges do precede big moves usually....is that correct? If a system does not require more than see signal punch button.....and it is not but slightly lagging each signal, and very near the apex, then signal is the item of the day....with the trend...horizontal trend is possible also, and seen often, correct? Ah Ha...different signals employed, this time top and bottom of horizontal trend..........even more easily seen....... all i ever see is chop and run...
 
ET forums posters seem to be much less knowledgable than the posters on T2W...huge difference in quality of comments......
 
ymonly said:
ET forums posters seem to be much less knowledgable than the posters on T2W...huge difference in quality of comments......


quality not quantity? 😱
 
With my occasional internet connection here in Thailand for the next few months I'll stand back and watch then...

And look forward to this addition to your book.

Porks.
 
is it over ....the springboards and hinges? I guess the interest is waning....maybe they are not important to most traders...sorry
 
ymonly said:
is it over ....the springboards and hinges? I guess the interest is waning....maybe they are not important to most traders...sorry

why not post a chart of your own?

Anyway, this is a YM chart of today:

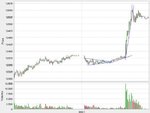
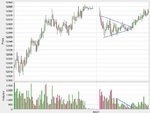
Price travels in between 12350 and 12370 making lower highs and higher lows, converging towards 12360 (the middle of the range). With the candles becoming smaller and smaller, so is volume decreasing along the way. However after price moving outside the hinge volume picks up again and we drift higher just before stalling before the intrest rate statement. I exited half of my position there, but the real energy was only released minutes later when we moved higher almost 200 points.
 

Attachments

  • ym_20070321a.jpg
    ym_20070321a.jpg
    49.7 KB · Views: 277
  • ym_later.jpg
    ym_later.jpg
    37.2 KB · Views: 254
Back
Top