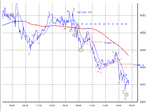
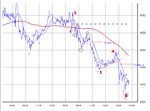
FTSE 100 January

morning
hooya
yes, I was expecting a less boyant start and it cost me some

I would have been ok if I hadnt changed the data to reflect that lower high we talked about yesterday.

If you remember, I said that meant we were higher up the wave.
If I had stuck with my original count, I would have called a 5 last night.

its a puzzle still.
 
cac and dax are more boyant this am.

sorry to hear it cost but know ing you it will only take one
trade to recover:)

Wave count is confusing, especially for a non pro like me. But
clearly is quite impulsive this morning but we have a longer term trendline, 60 min trend line and that 16 fib all above so will
take some move to break and stay above it dont you think
 
it may be that it has over reached.
It has pretty well hit my top line and left gaps.

but its not clear that it will fill the gap just yet.

a/d is in high 60's
 
just for the record, I have gone back and used my original data.

this is what it looks like.

as it happened, yesterday was quite profitable overall. Mainly from trading the Dow hedge.
not exactly what I had in mind at 16.30 ! :LOL:
 

Attachments

  • jan7.gif
    jan7.gif
    12.5 KB · Views: 218
Last edited:
bonsai/hooya

mornin' both

Have you been reading the "trading without indicators" thread?
Some good stuff there imo.

If I banned your indicators what would be your favourite chart
pattern to give you an entry signal (you show me yours and I'll
show you mine :LOL: :LOL: )

good trading

jon
 
a higher low

I bought this a couple of days ago
 

Attachments

  • ulvr.gif
    ulvr.gif
    20.9 KB · Views: 299
just out of interest why couldn't the first chart still be a 5 wave c
Bonsai,
 
Not sure Barjon. the ideal one for me would be both my 5 and 10 min very over sold, a spike at the low, and the macd looking to turn and with a break of the 1 hr with a break of trend in 5 min line chart.....basically every thing that happened at 8:01 this morning.

but looking at this at the moment
 

Attachments

  • screenshot052.gif
    screenshot052.gif
    4.4 KB · Views: 261
I cant see why having 1,2 drawn this way is so different to teh wave count?
 

Attachments

  • jan7.gif
    jan7.gif
    13.7 KB · Views: 249
3 waves consists of 5 legs and each leg consists of 5 minor legs.

I cannot count 5 legs in 5 of 3 in your version.

?
 
hooya - you cheated! I've banned your indicators and you're
talking about oversold, macd and 1hr ma.

bonsai - mmm, ulvr going great guns today

my favourites are shooting stars and hammers, particularly when
associated with upthrusts and springs (the shadow/bar has
ventured into enemy territory through resistance/support and
been promptly rebuffed)
 
ps.

and ulvr gapped up through the long black resistance @ 526.
very promising - course if it doesn't hold above 526 it will have
been an upthrust!!
 
barjon
as you know I don't (can't/won't) use candles.
the hammer used to be a favourite to watch out for but it usually needs confirmation (?)
They don't only seem to appear at bottoms

but I did like morning stars or evening stars.

"Love is the morning and the evening star"
Elmer

lol

ps: I thought hooya had cheated too.

tut tut

lol
 
but then shouldnt your pink 3 have 5 legs in 5of 3 or can we not go that
small?

hang on..you've labeled 5 legs in 5 of 3 whats the difference if its
Ibig 3 or your 3???IM all confused now. Its basically the same chart apart form 1,2????


Sorry for cheating, trendline breaks and higher low highs with triangle for contiuations are my thing
 
Last edited:
yes, its basically the same chart but without the starting 1/2
which would have required more to come.

I have decided that my original count was right and that confusion
about the high was a failed 5th.
I'll mark up the chart to show it in a minute.

But we must be boring the pants off non-wavers ? send me a pm if you want to continue with this ?
 
no dont worry. Im sure you are correct, just couldnt see
the difference in changing the 1,2 made to the rest of th chart
 
Top