You are using an out of date browser. It may not display this or other websites correctly.
You should upgrade or use an alternative browser.
You should upgrade or use an alternative browser.
lol thought you might say something like that.
Todays high was just short by 0.3 on my candle chart. ANd
Im not sure why I have this in my head but arent 2s usually a
clear abc? Thus your count is most likely and we still have a few gaps to fill.
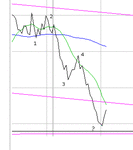
But the 10 min chart looks completely different.
Todays high was just short by 0.3 on my candle chart. ANd
Im not sure why I have this in my head but arent 2s usually a
clear abc? Thus your count is most likely and we still have a few gaps to fill.
But the 10 min chart looks completely different.
Attachments
Last edited:
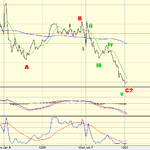
makes a nice 5 legs for 3 instead of my 7 🙂
edit: so many possible counts 🙂 but they all point to being in
some sort of C. Actually it is trying to channel which supports a
5 leg C. (I think) and at present it is taking the shape of a diagonal but could still be forming a parallel channel
edit: so many possible counts 🙂 but they all point to being in
some sort of C. Actually it is trying to channel which supports a
5 leg C. (I think) and at present it is taking the shape of a diagonal but could still be forming a parallel channel
Last edited:
hungrybear
Active member
- Messages
- 209
- Likes
- 0
Bonsai, my chart shows this morning as a lower high, as per Hooya.
I'm undecided if this is an abc or something bigger. We certainly overdue a decent retracement in all markets.
I'm undecided if this is an abc or something bigger. We certainly overdue a decent retracement in all markets.
have you noticed the "ads by google" at the bottom of the board?
I wouldnt like to trade one of the "winning alerts". I quote
"Max. Drawdown: 520%" !!!!!!!!!!!!!!!!!!!!!!!!!!!!!!!!!!!LOL
edit: and for a bit more fun....Which trendline to trade mmmmmm?
I wouldnt like to trade one of the "winning alerts". I quote
"Max. Drawdown: 520%" !!!!!!!!!!!!!!!!!!!!!!!!!!!!!!!!!!!LOL
edit: and for a bit more fun....Which trendline to trade mmmmmm?
Attachments
Last edited:
Similar threads
- Replies
- 982
- Views
- 110K


