You are using an out of date browser. It may not display this or other websites correctly.
You should upgrade or use an alternative browser.
You should upgrade or use an alternative browser.
not particularly
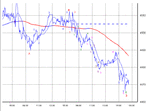
but the 1 day is now below my stop on the first trade and falling.
and also below a level that may provide resistance if it pulls back
so I am protected to a degree.
C waves are for making money. so unless this is a flash in the pan
the fib beckons
but the 1 day is now below my stop on the first trade and falling.
and also below a level that may provide resistance if it pulls back
so I am protected to a degree.
C waves are for making money. so unless this is a flash in the pan
the fib beckons
mmmm. the 1 day works a treat on all indices Bonsai but
it's knowing when to trade it and when not to. Want to
let me in on the secret.?
I went for the more safe option of an 87 ukx
short for 5. Dont forget the dow still hasnt closed it's gap today.
See you tomorrow. Off to learn some candle patterns out of Murphy's Book
it's knowing when to trade it and when not to. Want to
let me in on the secret.?
I went for the more safe option of an 87 ukx
short for 5. Dont forget the dow still hasnt closed it's gap today.
See you tomorrow. Off to learn some candle patterns out of Murphy's Book
CM
yes, unforgivable.
😆
It started off as a hedge against my ftse short but in the end
I traded it down as well as up. The signal was there to be taken
and I was using their money.
i.e the lower it went, the less I needed the hedge.
(don't do this at home)
yes, unforgivable.
😆
It started off as a hedge against my ftse short but in the end
I traded it down as well as up. The signal was there to be taken
and I was using their money.
i.e the lower it went, the less I needed the hedge.
(don't do this at home)
very tricky wave count today ?
especially as I lost my data feed for a while yesterday and didnt
catch the high towards the close.
but I have adjusted for that now.
all I can say is that it's my best effort.
comments are always welcome.
ftse now 91/95 which implies a break of resistance and
a break of the 1 day. Both looked unlikely at 16.30.
So, there is always the unexpected to deal with !.
However I won't be surprised if it opens lower than that.
Attachments
Last edited:
hooya
you are right again.It must be used selectively. When to use it is
just one part of my motor bike in pieces on the carpet.
There is no short cut,imo
I learned by printing out my charts every night and studying them
intently and intensely.
But in very simplistic terms, a failure by the market to pull back
through a falling 1 day means the active trend is down.
PS: Pull up a 1 min chart for the last 10/15 days and run both 1 day and 2 day. Can be useful sometimes ! 😆
Last edited:
leeshindig
Active member
- Messages
- 140
- Likes
- 0
bonsai
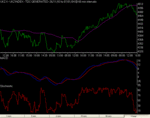
ever use a one week on an hour chart?...should be 42.5 but stockpoint doesnt agree with that figure........probably no use to the memer of the month....easy to see where we are heading with it tho
<img src="http://chart.neural.com/servlet/GIFChart?sym1=ls:ukx&cbcku=FFFFFF&cbckl=EBF5FF&cbckd=cccc99&ctxtu=000000&ctxtd=000000&ctxtl=000000&csym1=000099&csym3=000000&cbckg=FFFFFF&cind7a=FF0033&cind7=009900&cind8=blu&cind9=6666CC&avg1=42&ind7=macd&periodMACDLow=26&periodMACDHigh=10&ind8=rels&periodRSI=14&ind9=stoch&stochPeriodD=34&stochPeriodK=55&height=500&width=650&source=SP&multipane=1&watermark=splogoblue.gif&dres=hour&dcnt=2&dperiod=months&plottype=range&ignore=1220031852&coname=1&image=PNG">
leeshindig
Active member
- Messages
- 140
- Likes
- 0
hungrybear
Active member
- Messages
- 209
- Likes
- 0
looks impulsive this morning, suggesting the correction's over. Wave overlaps are acceptable on corrective moves, so we need to see a break above 4513 to confirm, but it looks highly likely. Not much of a retrace again, but more than Wall Street allows!
As soon as it fills a gap it leaves another one!
As soon as it fills a gap it leaves another one!
Similar threads
- Replies
- 982
- Views
- 110K


