You are using an out of date browser. It may not display this or other websites correctly.
You should upgrade or use an alternative browser.
You should upgrade or use an alternative browser.
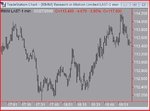
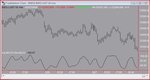
It appears from your charts that 10 min macci at the time was only 67.99 and 5 min was already down to 10.51. This wouldn't seem to me to be an ideal entry according to Iraj's intraday strategies, so I was wondering what your reasoning wasshort rimm
Charlton
It appears from your charts that 10 min macci at the time was only 67.99 and 5 min was already down to 10.51. This wouldn't seem to me to be an ideal entry according to Iraj's intraday strategies, so I was wondering what your reasoning was
Charlton
yeah, not ideal,
I wasn't really looking at figures, just turn levels
Glen
may look for quick scalp on klac and bby long
pizza getting cold tho
good job i didn't go long
Attachments
Blu-Ray
Active member
- Messages
- 111
- Likes
- 12
Belflan
I enjoy reading your trades, it's good to see if I'm spotting the same stocks and opportunities as yourelf.
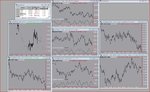
I just want to point that you're not updating your data compression for the n minute change. You've got it set at 10 min, for example on the chart with KLAC and BBY on it, it's taken around 18.45, so the n minute change so be set to a least 22 min.
Hope this helps
Andy
I enjoy reading your trades, it's good to see if I'm spotting the same stocks and opportunities as yourelf.
I just want to point that you're not updating your data compression for the n minute change. You've got it set at 10 min, for example on the chart with KLAC and BBY on it, it's taken around 18.45, so the n minute change so be set to a least 22 min.
Hope this helps
Andy
not sure what way to start setting out rules
just start prehaps?
1. Don't enter scalp trade within last 10mins of market open time
2. check position size indicator data compression before entry
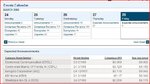
3. know if big news figure is being released within market hours
will add as go
Glen
just start prehaps?
1. Don't enter scalp trade within last 10mins of market open time
2. check position size indicator data compression before entry
3. know if big news figure is being released within market hours
will add as go
Glen
Belflan
I enjoy reading your trades, it's good to see if I'm spotting the same stocks and opportunities as yourelf.
I just want to point that you're not updating your data compression for the n minute change. You've got it set at 10 min, for example on the chart with KLAC and BBY on it, it's taken around 18.45, so the n minute change so be set to a least 22 min.
Hope this helps
Andy
hi Andy, thanks for the post
good point, I should have explained, i'm not using the n minute change.
it's a bit of a boll*cks (almost impossible) for me to download all the data from IB to T2ki for each stock therefore i can't trust the n minute.
I just look for the market cycle to get on my side,
look for a stock (like rimm or aapl) to pop up/down
then enter
we'll see how i go
cheers
Glen
how are you going
Blu-Ray
Active member
- Messages
- 111
- Likes
- 12
Glen
hehe... after reading this thread and your swing thread, I don't think a day go by when you don't have problems with T2Ki.
I think by not using the n minute change might be counter productive, since basically that's what the whole strategy is based around, for example just because AAPL or RIMM might pop down, when the $indu macci is heading down, it could be a very strong stock on the n minute change. And just looking at how those two babies move, i would not want to be on the wrong side as they can move at least a dollar in no time.
As for how I'm doing, it's actually going frightingly well.....Luckily TS8.3 has just brought out a simulator, so I'm just forward testing it at the moment, as I've been used to trading futures and never been involved with stocks before.
To make the transition a little easier, I narrowed the list of stocks down to about 13. Those being the ones with the greatest daily range, and basically just getting to know them and see how they react/move with the market ....... and as time goes on I'll put the rest back on.
Cheers
Andy
Glen
hehe... after reading this thread and your swing thread, I don't think a day go by when you don't have problems with T2Ki.
no sh1t
I think by not using the n minute change might be counter productive, since basically that's what the whole strategy is based around, for example just because AAPL or RIMM might pop down, when the $indu macci is heading down, it could be a very strong stock on the n minute change. And just looking at how those two babies move, i would not want to be on the wrong side as they can move at least a dollar in no time.
I want to have i think about this, and give it the reply it deserves tomorrow
As for how I'm doing, it's actually going frightingly well.....Luckily TS8.3 has just brought out a simulator, so I'm just forward testing it at the moment, as I've been used to trading futures and never been involved with stocks before.
great to hear this, well done mate
To make the transition a little easier, I narrowed the list of stocks down to about 13. Those being the ones with the greatest daily range, and basically just getting to know them and see how they react/move with the market ....... and as time goes on I'll put the rest back on.
good man, thanks for your input
Glen
Belfan- I am completely in agreement with Blu-Ray's post - the 'N Minute' indicator is next to the 'holy grail' (imho)- you might like to consider getting professional streaming data source for your TS- in the big scheme of things, the subscription fees, I think is quite insignificant- the tools that we have, if used properly, - your first trade of the month should take care of the fees and leave much extra 😀
Raj
Raj
I too agree with Raj and Blu-Ray, you can't hope to follow the strategy correctly without the correct tools. This will only lead to confusion.Belfan- I am completely in agreement with Blu-Ray's post - the 'N Minute' indicator is next to the 'holy grail' (imho)- you might like to consider getting professional streaming data source for your TS- in the big scheme of things, the subscription fees, I think is quite insignificant- the tools that we have, if used properly, - your first trade of the month should take care of the fees and leave much extra 😀
Raj
Even with one of the more expensive options Tradestation securities itself trading 5000 shares per month (that is 2500 each way) costs just $40 commission plus $10 market fee. Now Tradestation has also introduced a simulated trading account alongside, so you wouldn't need to keep trading for real for the remainder of the month once you have hit the 5000 shares if you prefer not to.
There are no connection problems, full access to the historical data, latest versions of tradestation and radarscreen - to me it seems a no-brainer,
Charlton
Glen
I think by not using the n minute change might be counter productive, since basically that's what the whole strategy is based around, for example just because AAPL or RIMM might pop down, when the $indu macci is heading down, it could be a very strong stock on the n minute change. And just looking at how those two babies move, i would not want to be on the wrong side as they can move at least a dollar in no time.
Andy
This is my understanding at the moment (from my limited experience)
I think the whole strategy is more so based around the market cycle turn, rather than anything else. Get the market cycle turn wrong and your entry will be crap regardless
The n minute change indicator looks at the movement of stocks in relation to the market.
If a stock moves down one ATR and the market moves up one ATR then the stock is weak in relation to the market.
If a stock moves down two ATR’s and the market moves down 1 ATR then the stock is weak in relation to the market.
What if the stock normally moves in tandem with the market (ie follows the market cycle.) and a stock like this was 2 ATR’s down the market was 1 ATR down would it be weak?
In the last hour of a trading day; if a stock that was prone to mean revision was 4 ATR’s down and the market was up 1 ATR, would this stock be weak? or over sold?
This is not in any way to question Grey’s indicators (Grey knows what he’s doing no one can deny this)
These are just my fumbling thoughts, trying to understand what we’re looking at when we look at the n minute change.
I don’t think (perhaps in my naivety) that the indicator on the stocks is as important as market direction (reading the turn)
Don’t forget during the webinar Grey did not use the n minute as a grail. He also used discretion as well (i.e. not entering a trade in a certain stock that was showing the greatest weakness (in the n minute) in relation to the market, as he new the stock and didn’t think it was a good idea)
I think there must be a lot of value in getting to know the individual stocks as well as using the indicators. Maybe grey has already though of this and has already picked the stocks that work well with this indicator?
Please don’t think of this as having a go at this strategy in any way, I very much see myself as a student here, Grey1’s is the Master (students should asked questions, draw conclusions, think, not just follow)
cheers
Glen
Last edited:
Glen
for example just because AAPL or RIMM might pop down, when the $indu macci is heading down,
if the indu macci was heading down i would be looking for a pop up in the stock for good entry (weak longs)
cheers
Glen
Last edited:
Similar threads
- Replies
- 2
- Views
- 3K