You are using an out of date browser. It may not display this or other websites correctly.
You should upgrade or use an alternative browser.
You should upgrade or use an alternative browser.
P&L looks a bit better than it did 😕
A couple of comments.
1. 52 week high/lows may be a bit of a blunt tool for this job, though it will be interesting to see how things pan out. For longs it may be better to consider lower cap stocks - maybe market cap < 2 Bil (or there abouts).
2. The market has had a period of indicision around the SPX 1400 level. This may be somewhat abnormal influence eg longs in high momo stocks taking their profits (or fearing losses) should the market pull back. Pure speculative opinion of course.
One should also be very carefull shorting severly oversold stocks in an oversold market. They can bounce savagely. Of course Grey frequently reminds us of this.
P&L looks a bit better than it did 😕
A couple of comments.
1. 52 week high/lows may be a bit of a blunt tool for this job, though it will be interesting to see how things pan out. For longs it may be better to consider lower cap stocks - maybe market cap < 2 Bil (or there abouts).
2. The market has had a period of indicision around the SPX 1400 level. This may be somewhat abnormal influence eg longs in high momo stocks taking their profits (or fearing losses) should the market pull back. Pure speculative opinion of course.
One should also be very carefull shorting severly oversold stocks in an oversold market. They can bounce savagely. Of course Grey frequently reminds us of this.
yeah, I think there's a bit to go yet before a have a creditable pair trading strat.
It's early days, but I'm also thinking 52 week high/lows is not really a great way of doing this, and I may change this it in a while.
one thing I was thinking about using was a monthly radar looking for stocks that are showing strength to market and have the lowest macci. Then moving to the day TF for entries
I'll keep going,
belflan
I may also need to take into consideration the stock beta, as it would seem that this strat could tie up quite alot of money in stocks that don't move very much. need to think this through tho
the more I think about this the less I think this approach is a good one
holding a long portfolio and short portfolio of these stocks at the same is a very expensive way of doing business, tieing up alot of funds.
I guess what i really searching for here, is a good pair trading strat, the idea of holding such large positions both sides of the market, gives up the one advantage a retail trader has over large traders (nimbleness)
I think I'll move the thread on now to look at more specific pair trade opportunities
and get one of the mods to change the thread name
belflan
please do not see this as jumping from strat to strat in an unfocussed way
I have learnt alot of practical things from running this thread so far, I see this as a natural progression after looking into a (quite large) long/short portfolio for a while, and learning what the requirements are in holding one. Now its time to move on....
I'll call all the trades closed with a loss of $1,602
I'll revert back to a $30K trading account therefore account balance = $28,398
Last edited:
running total = -$1,422
just out of interest this strat would have gone break even today
Last edited:
ok, need to do a little more thinking about what i'm trying to do on this thread.
I ditched the idea of holding a long/short portfolio, as the funds required to do this correctly are too great ($100K.) I'm trying to keep all that I do on TT practical enough so that i can implement it live in the future. Having $100K tied up in a short/long portfolio is not practical for me.
However I do like the idea of being both short/long at the same time. So, I'll try to develop and forward test a simple pair trading strat on this thread from now on..
From looking at the previous pair trading thread. It would seem best to look for stocks in o/b and o/s condition and simply buy the o/s stock and sell the o/b stock.
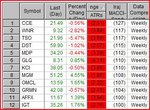
I've attached a screen shot of 6 stocks the 3 on the left are over o/s both on weekly and daily cycles and vice versa for the 3 stocks on the right.
Attachments
ok, need to do a little more thinking about what i'm trying to do on this thread.
I ditched the idea of holding a long/short portfolio, as the funds required to do this correctly are too great ($100K.) I'm trying to keep all that I do on TT practical enough so that i can implement it live in the future. Having $100K tied up in a short/long portfolio is not practical for me.
However I do like the idea of being both short/long at the same time. So, I'll try to develop and forward test a simple pair trading strat on this thread from now on..
From looking at the previous pair trading thread. It would seem best to look for stocks in o/b and o/s condition and simply buy the o/s stock and sell the o/b stock.
I've attached a screen shot of 6 stocks the 3 on the left are over o/s both on weekly and daily cycles and vice versa for the 3 stocks on the right.
only problem when scaning stocks for o/s or o/b conditions on weekly and daily cycles, is that they are nearly always showing weekness to the market for o/s stocks and strength to the market for o/b stocks......hmm..long?short?long?short?
only problem when scaning stocks for o/s or o/b conditions on weekly and daily cycles, is that they are nearly always showing weekness to the market for o/s stocks and strength to the market for o/b stocks......hmm..long?short?long?short?
i would guess looking at stocks that are firstly o/s on their weekly cycle and also o/s on their daily cycle, what i should be looking for next would be an up turn in their daily macci and some strength to the market for a period, for an entry long, and vice versa for shorts..
I have around 650 stocks currently within GlobalServer. so maybe the approach should be:
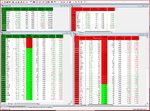
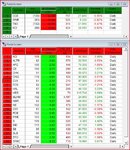
1. identify stocks that are o/s and o/b on their weekly cycle
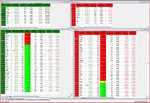
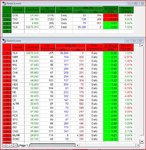
2. narrow the stocks down by looking for o/s and o/b condition on their daily cycles
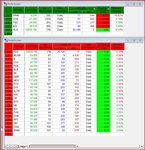
3. take these lists of stocks and await strength/weakness to market for entries
...........
1. identify stocks that are o/s and o/b on their weekly cycle
...........
.
Attachments
2 narrow the stocks down by looking for o/s and o/b condition on their daily cycles
...........
.
Attachments
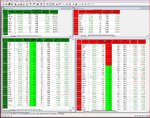
3. take these lists of stocks and await strength/weakness to market for entries
...........
will wait and see if any of the posible longs and shorts show strength and weakness to the market for entry during this week.
well see..
will wait and see if any of the posible longs and shorts show strength and weakness to the market for entry during this week.
well see..
no long list stocks shown strength to market
no short list stocks shown weakness to market
belflan
Attachments
been waiting over hour for data to download (feck sake)
still waiting🙄
still waiting🙄
after all that, no poss longs showing stength to market, no poss shorts showing weakness to market
belflan
Attachments
still waiting🙄
will up date this strat tomorrow tonight, let download run over night


