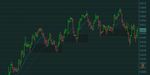
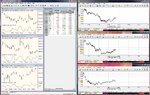
short aapl and rimm
two a'hole trades trying to chase losses
short aapl and rimm
Hi belflan,
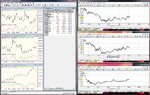
Not an easy day; more choppy than a very choppy choppy thing!
Tim.
Addition to trade performance monitoring
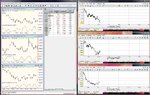
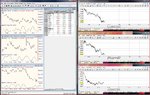
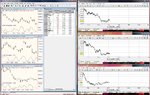
hmmmm, started thinking about yesterdays trades,
the aapl trade was one of the biggest losses (and intra trade draw downs) I've had so far trying to scalp.
I started thinking, well maybe it's got something to do with the indu macci levels on at my entry. went back through all my trades and entered the macci level of the indu at the time of trade entry into my spread sheet. didn;t ready show much up (as i'm really interested in the turn not the number)
(penny dropped) all I'm trying to do with the macci, CNBC etc is = READ THE MARKET DIRECTION
Therefore, i've now add another few columns to my trade record spread sheet, which shows the indu value on entry and exit of trade. (CAN'T BELEAVE I DIDN'T THINK OF THIS BEFORE NOW)
looking at yesterdays trades my reading of the market it's self was ok,
allowing 1pip for spread (no commissions allowed, don't know what they would be for futures) I would of made 22points.
makes me think, perhaps trading the indu it's self could smooth out losses on days like yesterday, when my reading of the market is ok, but my reading of the stocks is not,
hmmmmmmmmm, keep thinking
belflan
short aapl