You are using an out of date browser. It may not display this or other websites correctly.
You should upgrade or use an alternative browser.
You should upgrade or use an alternative browser.
Trading ES (Q1 2004)
- Thread starter china white
- Start date
- Watchers 10
stoploss please
Established member
- Messages
- 780
- Likes
- 10
I was convinced in was going down aswell.
frugi
1
- Messages
- 1,843
- Likes
- 133
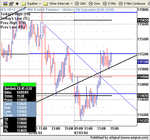
Now that's what I call a 1-2-3! Hit tri/inv H&S target and 61.8% res (1 Mar hi to today's low) at 1152 now. Shame I screwed up in the morning or this would have been a good day.
I think the Fed may have stepped in with some concentrated futures buying / liquidity to defend the third fan line. They really don't want to see that fail.
Bit confused by this trend/non-trend distinction. I thought the morning had the hallmarks of a down trend day, 2:1 internals, SOX/COMP leadership etc. yet ES barely trended at all, instead coiling up into a triangle that ends up bursting upwards with savage force.
Is this an aberration day? (Asks just as China goes on holiday, timing eh!)
Last edited:
stoploss please
Established member
- Messages
- 780
- Likes
- 10
People (oops nearly said chaps then! 😉)
Just read through this, and it seems that a lot of us were thinking on the same lines, no doubt Skim will put us all right later!
Just to make you all feel better I was stopped out on two shorts myself too. 🙁
Cheers
Q
Just read through this, and it seems that a lot of us were thinking on the same lines, no doubt Skim will put us all right later!
Just to make you all feel better I was stopped out on two shorts myself too. 🙁
Cheers
Q
stoploss please
Established member
- Messages
- 780
- Likes
- 10
Skim's one of the lads so I am sure she won't mind.
stoploss please
Established member
- Messages
- 780
- Likes
- 10
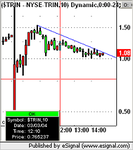
Just reading back through the posts. According to the Oracle of the Dark Side, this congestion does not look topish. What do you guys and girls think.
Hi stopl loss I also follow the trin to a certain extent and agree that the trendline can help to determine direction, but with it being over 1.0 is this likely to keep the bullish aspect under cover, ie limit the extent of the upward direction.
Just a thought, maybe nothing in it.
Just a thought, maybe nothing in it.
Well...I certainly agree that it's congestion :cheesy:
Q
Edit; And now to be serious - I would have thought that with all that fresh air around the third spike, that it is toppy. Plus if we add in the Tick -ve div, and round it off with a nice bearish nature - there we are.
Chartman didn't name me Quercus Shorticus for nothing! 😆
Q
Edit; And now to be serious - I would have thought that with all that fresh air around the third spike, that it is toppy. Plus if we add in the Tick -ve div, and round it off with a nice bearish nature - there we are.
Chartman didn't name me Quercus Shorticus for nothing! 😆
stoploss please
Established member
- Messages
- 780
- Likes
- 10
Well, The market certainly knows I'm a beginner and is showing me that you can read as much theory as you like, but until you start pressing that button regularly you know nothing!
Fortunately @ £1 per pt not too much damage being done, and my UK equities stiil performing quite well.
Anyway, todays Tick
Fortunately @ £1 per pt not too much damage being done, and my UK equities stiil performing quite well.
Anyway, todays Tick
Attachments
stoploss please
Established member
- Messages
- 780
- Likes
- 10
Hamps
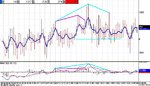
I have noticed a bullish and and bearish pattern in the tick MA.
Do you see those two W shapes at 10.35 and 12.35. They seem to work in certain conditions,
I have noticed a bullish and and bearish pattern in the tick MA.
Do you see those two W shapes at 10.35 and 12.35. They seem to work in certain conditions,
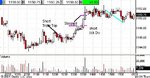
Now Today's ES.
I had seen both the double/triple top and the potential inverse H+S, so the 1st short was a complete punt and got what it deserved. ( - 2.1 )
2nd short on Tick/Es div, but dubious MACD. When will I learn to wait for a proper setup 😡 ( - 2.4 )
Better setup ( in blue ) did arrive but tick had hardly crossed the zero line, so elected not to take it. Patience may have yielded a couple of pts but after 2 losses I'd probably have been spooked out early.
I shall now go and write 100 lines 'wait for a proper setup'
Cheers, hampy
Attachments
Similar threads
- Replies
- 11
- Views
- 8K
- Replies
- 67
- Views
- 17K
- Replies
- 11
- Views
- 6K
- Replies
- 202
- Views
- 79K