Trading ES (Q1 2004)

Hampy,

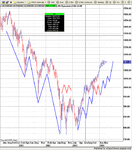
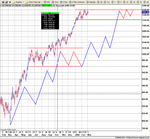
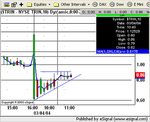
Just a word about your second short if I may (no offence intended). Look at the big triangle and the volume pattern while it forms. It takes 4 hours to coil up tighter and tighter while the volume dries up to almost nothing. Everyone is awaiting the big move and it's going to be big because the waiting period has been long and frustrating. The breakout comes on two much bigger vol bars that close above the triangle (confirmation) and then the target is 1152 or so. After a long wait like that I wouldn't stand in the way of the resulting move unless a target had been met (though I often do :D) and the little triangle where u shorted was too close to the triangle.

However I do sympathise because it was close to the bottom of the long term channel that we fell out of this morning. I closed a long there, in fact, so I'm not qualified to chastise anyone! Oops.

Sorry if this sounds a bit harsh mate - it's not meant to. We're all learning at the end of the day :D I got a lot wrong today. We must learn to trust the triangle with confirmatory volume and perspective!
 

Attachments

  • clipboard.gif
    clipboard.gif
    45.2 KB · Views: 249
Last edited:
You can often tell, if the final peaks/troughs fail to make support /resistance. In this case, they all made it, making a correct call harder.
 
The SOX just prior to this break was making new lows. Only the banks were performing with any strength. My bias was to the down side. If we had broken the major uptrend line, there was a lot of clear air for a sustain fall. Does anyone think there may have been some manipulation today.
 
Andy,

No, but I was biased towards (or happier with) long because:

Messy 5 wave down pattern also completed a bigger ABC.
The bottom was on savage volume. Aye I know...hindsight :LOL:
The 1-2-3 setup betweem 15.15 and 18.15. Messy but unmistakeable.
Support of third fan line / little channel bottom on daily chart
OS RSI
At lower pivot S1
Breakout started above 10 EMA
Erm
I went long hehe

I could probalby find 5 reasons for preferring short too!

Look at me pretending to be the expert. Where's our wise Oracle? Busy knitting me a Clanger perhaps :cheesy: I wish...

http://www.frugi.co.uk/trading/untitled3.jpg
 
As regards manipulation - yes, of course. The Fed's always dropping in with a few dollar when key support is in question. Nothing conspiratorial about it, just good old capital being employed where and when it's needed. In election year there's usually more of it.
 
Hi Frugi

I did notice the volume at the time and the market did turn but the phase was as Skim would say was all chop suey. I also agree about the 123 pattern but in this case it was both a bullish and bearish set up. I knew it was going to break but was not sure which way.

What caught me out was the other sectors. It looked to me as a down trend day. However, saying that, we were hugging the trend line going back all the way from last March.

I like your use of Elliot Wave. This is one area I have been trying to master but finding it hard work.
 
Frugi
Nice clear chart, I particularly liked the downtrend line on volume which was really showing the "coiling" of the spring. I should look at this a bit more carefully than I do at present! ;)

Here's a question which you can all ponder while I'm sleeping!
Is this a wave 4, and if so is it a 5-wave EW triangle correction,which apparently occur in wave 4 more frequently?
If so do we go for the upside target of wave 5 equalling wave 1 and therefore approximately 1155.5 or should it be higher due to the inverse H&S so maybe 1160?
Who knows, certainly not me! :LOL:
Cheers
Q
 
Andy/Quercus

"I like your use of Elliot Wave. This is one area I have been trying to master but finding it hard work."

"Nice clear chart, I particularly liked the downtrend line on volume which was really showing the "coiling" of the spring."

Cheers both of you.

EW sure is confusing. Sure I may have got it right after the event but as we all the know the overriding difficulty with EW is knowing where to start the count and how much to zoom in or out from a given chart. There is usually an EW pattern visible to justify just about any interpretation if u look hard enough!

However I do like Skim's approach of only trusting the ones that announce their presence with blinding clarity and lack of ambiguity.

The 5 down / ABC up the day before yesterday was an example of that as was, I believe, the big ABC that finished yesterday's sell off. However yesterday's ABC could have become a 5 down if the upmove had stopped lower than where it did at 1153 (i.e forming a wave 4) and then plunged for a final 5. Fortunately it didn't and probability was slightly against this happening becuase the previous long up move was a 5 pattern, so you'd expect a 3 to follow.

Now that was a model of clarity, not!

But start talking about leading diagonals and flat 3s and I'm utterly lost. 5s and 3s is about all I can understand.


untitled4.jpg
 
Frugi

Do you think it is worth taking a top down approach when it comes to EW. ie, Look at monthly time scales and identify the trend, and then just drill down through all the time scales.

Also, do you know if anyone is offering a Wave scanner for real time data.

Cheers
Andy
 
Andy,

I think that would be a sensible approach, much as one might look to the longer term charts for major direction inflection points and then enter and exit positions using shorter term ones to fine tune. Yesterday the daily chart trendline stopped me shorting heavily when all looked bearish on the minute charts and I guess in the same way a big Elliot wave is likely to overpower his little brethren when push comes to shove.

I believe www.elwave.com offers a real time wave scanner.

With apologies to hahnscorner.com I have nicked a Fib timing chart for the NDX. I won't make a habit of this and will remove it immediately if a mod would like me to. There are four timing projections in the last hour of trading today (one not shoen from the hourly chart) which would suggest a significant inflection point. If we are high into the close expect down tomorrow and vice versa. Sideways is not much use though. Food for thought anyway.
 

Attachments

  • ndx15min.gif
    ndx15min.gif
    53.3 KB · Views: 325
All waves of similar degree will relate :cool:

The problem is that waves may be relating to other degrees of past price series , so the identification of the current ratio Rhythm the market is tracing out.. is a must IMHO .. in order to simplify and eliminate waves that are old or stale which over complicates the count.

Page 26/27 on the no indicators thread may help :?:

http://www.trade2win.co.uk/boards/showthread.php?s=&threadid=7751&perpage=15&pagenumber=26

CJ
 
Last edited:
The daily chart

If we are now at the end of an ABC correction of wave two up. Would this mean we are at the beginning of the final wave three up. I'm confused. :confused:

Skim, where arte thou.
 

Attachments

  • dow 5min256.png
    dow 5min256.png
    172.4 KB · Views: 282
Triangle

On that break out, the Trin stop putting in HH's but it did not manage to break that up trend line. The transports seem to be putting on a break on todays action. Looking for 1154. Please :D
 

Attachments

  • dow 5min258.png
    dow 5min258.png
    33.7 KB · Views: 292
I'm here. I didn't trade yesterday as I took the day off, and today I just feel too knackered to even press a buy or sell button (I'm not that well actually).

I just use the five-wave, and trade it when I see it - I never retro-fit waves because it is just too much like hard work and I'd only get myself tied in knots trying to work it all out.

Until the Dow, Nas and S&P get their act together, we're just going to go sideways - look at the following to see how they are not in sync. The COMPX is bullish, and the Dow is bearish - so we're not going anywhere fast until they do.

On the 30 min chart there is a sort-of inverted h&s with the neckline at 1153, so there may be a nice deep pullback needed down to 1147 before we go up.
 

Attachments

  • us market watch.jpg
    us market watch.jpg
    31.3 KB · Views: 267
Ahh, the Cotswolds - how I miss them!
Bourton-on -the-Water
Stow-on-the-Wold
Upper and Lower Slaughter
Chipping Norton
Moreton-in-Marsh
It's all you need to soothe the spirit, and heal the hurt!
Plus of course some chamomile tea, with maybe just a drop of the hard stuff!
Q
 
Top