Trading ES (Q1 2004)

sandpiper - i said it once last yr and ignited angry responses (just joking :) ) of those who follow Mohan

PERSONALLY - pls followers of Mr Mohan dont bite me, it is my opinion only - i think that incorporating ANY individual stock for the purposes of INDEX trading is ...... how shall i put it? making yr life a bit harder. U CANNOT trade indices on individual stories - IMO.
 
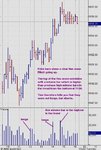
In the post above (http://www.trade2win.co.uk/boards/showthread.php?s=&postid=84172#post84172), I posted the chart as it reached the very top of the trend - 1157.50 was the high of the day.

It just takes a bit of practice, but this is how you do it. The five-wave Elliott is easy to see, and when you know you are on wave five, you just wait for the volume to tell you when the big boys are shorting - when you see that, you know you're at the top. The highest price bar is often the bar after the high volume bar prints, and to get out right at the very top I use the 5 minute to time the exit after the 10 min high volume bar.

It's just a case of using your eyes to see volume in conjunction with a price pattern, and it works a treat.

This is the ES 10 min chart following on from the one I posted above.
 

Attachments

  • cme-es04h- 10 minute.jpg
    cme-es04h- 10 minute.jpg
    55.3 KB · Views: 354
Thanks Skim,

I assume that once uve identified the top its a matter of shorting with the big boys and using the inverse of what had previously happend with the volume bars helping u distinguish the different waves down?

Thanks

Triplepack
 
After a five-wave, you would expect an abc correction. It's best to just trade those as they happen, without concerning yourself with volume.

You can see that the abc correction was just a lot of sideways action with a failed attempt to go higher on the last but one bar (the one which has a higher high and a higher low).

Volume is like price patterns - when it's nice and clear and easy, you trade it. If, like with price bars, you get too close to them you will just confuse yourself.
 
Skim,

Thanks again for the continual stream of clear explanations.

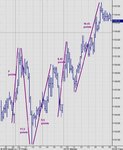
Given the height (11 pts) and time (4 hr) of the 5 wave up would you not expect the ABC correction to occur tomorrow? The sideways action after 8pm just doesn't seem enough, if u know what I mean.
 
Beginner Alert

Hi all,
A few Q's after today's action. ( Sorry, on the wrong PC to post charts)
Took one really poor trade on a dubious Tick Neg div without MACD. I suspect this was a bit of impatience coming in to play, instead of waiting for a proper setup. Result - 3.6
Later in the day took a better neg div, but realised that as Tick had only crossed the zero line a couple of times all day this was a scalp. Exited for a huge + 0.3, but at least this confirmed my thought process.

China, from a Tick point of view on a no trend day, I never saw a pos div to initiate a long, no surprise I guess as Tick was in positive territory nearly all day, so I wondered if you positioned yourself long from another point of view?
Looking back at the chart now entering a long every time Tick hit the zero line would have been fairly profitable. Any thoughts?

In hindsight then the way to play today would have been to go long just after 1100 est, when price went thru the lower pivot but then failed to fill the gap and retraced immediately, accompanied by a nice volume spike. Thereafter looking for one of Skim's 5 waves would have yielded around 10 pts.

It's starting to sound easy again, I think I might even be looking forward to tomorrow :cheesy:

Cheers all, hampy
 
frugi said:
Given the height (11 pts) and time (4 hr) of the 5 wave up would you not expect the ABC correction to occur tomorrow? The sideways action after 8pm just doesn't seem enough, if u know what I mean.

Yes. And I do know what you mean.

That comment of yours is brilliant, because it shows that you're getting a feel for what the market does and the way she moves, and that sideways action/pullback/correction 'just doesn't look right'.

If you look at the COMPX towards the end of yesterday, she made a higher swing, yet ES and INDU made a swing lower, so already we're out of trending mode.

Your comment about the points reminded me of something which I forgot to point out (pun intended!). LOL. It's the length of the waves, shown here on the 10 minute chart, which also gives you a feeling for where you are in the wave and when a correction is likely:
 

Attachments

  • cme-es04h- 10 minute.jpg
    cme-es04h- 10 minute.jpg
    86.1 KB · Views: 308
3.30 checklist

10 min:
In B wave of ABC correction after 5 wave up.
LL and LH printed so far today

Pivot 1152.25
Retracements of 5 wave 1153.4, 1152.1, 1150.8
Support at LOD / top of yesterday's long consolidation 1153.25

Dow down 0.25%
Naz up 0.18%
SOX up 1.13%
XBD up 0.59%
BKX up 0.07%
ES flat

A no trend day? (I still haven't grasped this!)

RSI declining from OB.

Possible 123 setup forming.

Also on 60min: Declining volume on advance since lows of 24/2
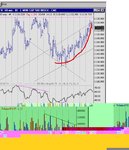
Top of channel with last up move looking a little parabolic. French curve trendline?
RSI declining from quite OB.

SHORT... Initial targets Fib levels.
 
stoploss - stop right there :) i dated a french girl from Toulouse :) pls dont turn this thread into french curves discussion .... :)
 
where now? some thoughts

well within the uptrend in ES with the C&H target of 1157.50 fully met. Time for the handle to develop imo
 

Attachments

  • cme-es04h- 15 minute.jpg
    cme-es04h- 15 minute.jpg
    52.5 KB · Views: 224
comp

same pic more or less on comp
 

Attachments

  • nasdaq combined composite indx- 5 minute (all sessions).jpg
    nasdaq combined composite indx- 5 minute (all sessions).jpg
    74 KB · Views: 230
sox

BUT the extra macho :cheesy: behaviour of SOX makes me think it'll be just a handle - with more upside ahead
 

Attachments

  • semiconductor sector index- 5 minute (all sessions).jpg
    semiconductor sector index- 5 minute (all sessions).jpg
    66.9 KB · Views: 235
With thanks to Jiler's "How charts can help you in the stcokmarket"

An interesting variation from the straight line trend is the curved trendline. In some cases, the momentum of an advance or decline suddenly picks up steam so rapidly that an established straight trendline curves in the direction of the move. If this curving occurs after an extended price move, it frequently results in a climactic action that brings the movement to its final peak (trough). Volume is usually abnormally high. This type of trendline can be drawn with a French Curve, which is a draughtsman's instrument for tracing various curved lines.

Here's the ES hourly. Admittedly the volume pattern does not really confirm a blow off top. As u can see I do not have a French curve tool just an inept hand.

PS Covered shorts until this 5/10 mi downsloper does summat interesting. 3 touches on top and bottom so perhaps a breakout & trend during/ after lunch.
 

Attachments

  • untitled.jpg
    untitled.jpg
    94.8 KB · Views: 228
Last edited:
Skim

As yesterdays action gave you your five wave up. Out of interest, do you sit back and do nothing apart from some knitting until the morning messy bit clears up.
 
alr8 lads/lassies - we need a lauph here dont we

Frugi mate - what am i supposed to make out of your latest quote: "As u can see I do not have a French curve tool just an inept hand"?????? :) mate if u said that on the floor - u'd be famous in the City forever!

cheers m8 - very good analysis btw
 
...pausing momentarily to slap HUI with it.

Anyone know if a saucer with platform follows the same principles as a cup and handle, i.e. volume patterns, targets etc. despite being shallower? Are they in fact the same formation in different magnitudes? And is a cup & handle target the height of the cup? TIA.
 
Last edited:
Top