You are using an out of date browser. It may not display this or other websites correctly.
You should upgrade or use an alternative browser.
You should upgrade or use an alternative browser.
Trading ES (Q1 2004)
- Thread starter china white
- Start date
- Watchers 10
- Messages
- 2,325
- Likes
- 17
Sorry, must have missed it. I'll just crank up the old charting proggie and have a look now.
china white
Established member
- Messages
- 979
- Likes
- 12
stoploss - the general answer is the shorter the time span of ANY div - the shorter (and smaller) move follows.
u may turn yr radars into 1-min mode, and u'll c plenty tick divs - however the moves that they point at r usually really nervous scalps. nothing wrong about it - but I am personally more comfortable with 5-min windows where u get decent moves after tick divs.
there is a couple of exceptions - but as Skim says u'll see them with more practice. imagine at 10:30 u r at UP, no-trend day, no particular divs across indices. then something spooks the mrkt and it quickly falls to 1-2 pts below LP. still no-trend internals etc... u will "feel" this moment when ES stalls and sort of jibbers in the air - sorry cant describe it better - and if u get strong enuff tick pos div ON JUST 2 5-min BARS, u may want to go. But u really need to develop a feel for it.
- Messages
- 2,325
- Likes
- 17
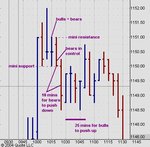
Quercus said:At the stronger three steps up around 10:15, there was a drop of 1pt followed by a DT on the 5min chart. Is this something to keep an eye out for in the future, as it seems to form a level of what you might call "mini resistance"?
Yes. Any two bars which form a DT are showing you that there's resistance there (in 10 minutes, 2 x 5 mins, the price was unable to go higher). The first of those was a doji, showing indecision (bulls = bears), and in the second one the open was at the top and the close was towards the bottom of the bar, showing you that the bears were stronger and in control. So we went from indecision to bearish, and so you would have to be short.
It took 10 mins (2 x 5 mins) for the bears to push the price down, then the bulls took 25 mins (5 x 5 mins) of mainly sideways action to push the price back up. So therefore you could see that the bears were stronger, even though the bulls were trying to fight back.
And that's all it is really - a game of bulls and bears and reading who's in control.
I'm not that clued up on the Ross Hook, so I'll need to rifle through the stuff I have to find out what it is! LOL
Attachments
Thanks for that Skim
Q
Edit:
Now this is interesting!
I know data can and does change from supplier to supplier etc. I thought I was seeing things, but now you've posted that second chart, I wasn't!
If you go back to the original one you posted you'll see that the first bar of the DT was not a doji, and the second one does not have an open in the top and a close near the bottom - they are in fact close together and not giving such a strong bearish signal. How is it that this data has apparently "changed"? Am I just picking holes in this?
It's obviously still a DT over the two bars and I am happy with the explanation of the bullish/bearish battle, but this data anomaly problem is interesting is it not?
Cheers
Q
PS One of them has even changed colour! 😕
Q
Edit:
Now this is interesting!
I know data can and does change from supplier to supplier etc. I thought I was seeing things, but now you've posted that second chart, I wasn't!
If you go back to the original one you posted you'll see that the first bar of the DT was not a doji, and the second one does not have an open in the top and a close near the bottom - they are in fact close together and not giving such a strong bearish signal. How is it that this data has apparently "changed"? Am I just picking holes in this?
It's obviously still a DT over the two bars and I am happy with the explanation of the bullish/bearish battle, but this data anomaly problem is interesting is it not?
Cheers
Q
PS One of them has even changed colour! 😕
Last edited:
- Messages
- 2,325
- Likes
- 17
My pleasure 😀
Don't expect to just 'see' it - it takes a lot of time of patiently watching and observing before you start to see what is there.
I remember when I started; it all looked like chop suey to me, but gradually over time I started to see the characters of the individual beansprouts. :cheesy:
It's easier for me - I've seen 26,000 bars form in real-time, so you've some way to go to catch up! LOL
- Messages
- 2,325
- Likes
- 17
I can't see any difference Quercus - are you sure you're looking at the same timeframes?
One chart I posted is 10 mins, the other 5 mins. Both 5 min charts look the same to me (3:53pm yesterday, and the one just posted), and both have dojis. I've also posted a chart of the COMPX 5 mins, which does look different - because it is! LOL
Good vintage, is it? :cheesy:
You can get slight differences depending on which server you're on, so that may explain the odd one tick difference between bars.
Well, it's probably the caffeine as it's midday here! Or maybe the beansprouts I had for lunch WERE fermented! 😆
BUT if you look at the first 5min chart which you posted it IS different! The one with the multi-coloured 1-2-3 patterns, or maybe I'm seeing too many colours now as well!
Blimey, I need a break and it's not even Sunday night here!
Q
BUT if you look at the first 5min chart which you posted it IS different! The one with the multi-coloured 1-2-3 patterns, or maybe I'm seeing too many colours now as well!
Blimey, I need a break and it's not even Sunday night here!
Q
- Messages
- 2,325
- Likes
- 17
The things I do ...
Out of the 35 servers, I've just flipped through 19 of them, and I cannot get the doji to be anything but a navy blue doji. The only changes I can get is an open one tick lower on the bar after the doji.
Yes, I do see what you mean - there is a slight difference of one tick, which has changed the bar colour. My understanding is that the data feed cannot be any more than three seconds out from the exchanges, so there will be very slight differences between data providers, giving different bars patterns. But you're not reading just one bar, you're building a whole picture, so it shouldn't matter that much if one bar is a tick out.
It's Monday where you are, and lunchtime, so have a glass of vino on me!
😆 The things you do indeed, and on a Sunday night too. 😆
What's a tick between servers, and after all I am trying to keep it simple - so we'll leave it at that. It's still quite clearly a 1-2-3 AND a top so I don't know what I'm on about really!
I'll have that glass of wine, and you should be tucked up in your burrow or the Owls will be after you!
Cheers
Q
china white
Established member
- Messages
- 979
- Likes
- 12
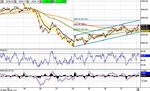
50% fib on Comp - so: is it C&H or bear flag? :
http://www.ttrader.com/mycharts/display.php?p=19923&u=chinawhite&a=China\'s ES&id=915
2045 is key - if not taken ot fast, it'll be viewed as a DT imo
http://www.ttrader.com/mycharts/display.php?p=19923&u=chinawhite&a=China\'s ES&id=915
2045 is key - if not taken ot fast, it'll be viewed as a DT imo
china white
Established member
- Messages
- 979
- Likes
- 12
china white
Established member
- Messages
- 979
- Likes
- 12
hampy - perfect example of what Skim mentioned e.g. - today u wanted to be long 1148 at the open or even from after hours - for good 4 points.
stoploss please
Established member
- Messages
- 780
- Likes
- 10
Thx China, I see what you mean.
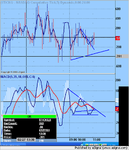
Haven't taken a trade yet, no obvious Tick divs, but I did notice that whilst the 1152.75 top was not indicated by a Tick div, it did show as an RSI neg div with Chartman's Dow setup.
I also noticed this a few times last week and just wondering if it might be a useful addition to your system with little effort, just another chart which could be minimised, and viewed occasionally.
( INDU 1 Min chart with RSI 14 )
What do you think ?
hampy
china white
Established member
- Messages
- 979
- Likes
- 12
hampy mate - i am actually in an awkward situation trying to answer yr Q 🙂
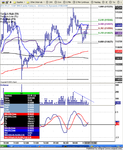
CM's use of RSI is brilliant and he definitely sees what I dont see in RSI. I just may be a bit too thick to suss it 🙂 however, all I am using rsi for is an additional VISUAL info when its overbot/sld on NON-TREND days. On trend days RSI being overbot/sld (like any contrarian indicator) makes actually more harm than use imo.
Now if I say i dont like stochastic indicators of mrkt velocity (such as RSI) - u'll call me a complete and utter Bliar 🙂 since I am using Macd - which comes from the same league.
so i will have to say - i just dont like it..... 🙂 like i am not at all into blondes - even tho they may be gorgeous. just not my type 🙂
hampy - C WHAT U R most comfortable with - not me or CM or Deus Santos himself. Market manifests itself in many ways and u need to figure out which of those alleys is the easiest for YOU to walk 🙂
stoploss please
Established member
- Messages
- 780
- Likes
- 10
Fair enough China, I appreciate your comments.
I need to take the info from several sources and mould them into my own system.
I think you have a great method for defining trend/ no trend, and I find the Tick/Tick MACD easy to spot, it's just they miss some of the decent turns which I'd noticed the Dow RSI divs gave.
I shall continue to look at this on no trend days and let you know how I get on.
The one thing I am struggling with is Skim's pure price action.
I have printed off and read loads of her posts. I know plenty of theory now but really struggling to see the moves in real time.
I shall persevere!
Cheers,
hampy
stoploss please
Established member
- Messages
- 780
- Likes
- 10
Hamps
Are you looking at ES Volume. Especially climatic sell offs and highs or double tops were the volume on the second top is lower than the first. We maybe getting a LH on lower volume as I type.
Are you looking at ES Volume. Especially climatic sell offs and highs or double tops were the volume on the second top is lower than the first. We maybe getting a LH on lower volume as I type.
China's right. We have all found what we are comfortable with. We all think our own way is best. You have to do the same. Somewhere along the road you will find something that serves you well. And it is a long road. As for price only action, that will come in time, but it's close to the end of the road as opposed to the beginning, so don't fret about that for now.I know Skim went round the houses several times over a few years before finally finding her Grail.
Similar threads
- Replies
- 11
- Views
- 8K
- Replies
- 67
- Views
- 17K
- Replies
- 11
- Views
- 6K
- Replies
- 202
- Views
- 79K