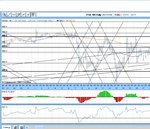
swingin' the ftse: 2009

thanks for the link tim. you've just freaked me out re the trendlines though!

i like to use geometric trendlines (channels) on the FTSE from 8 am to 1 pm. just as little notes on movements and their pace.

they generally appear very well respected by the market (i latch them onto key events and simply copy them over for the rest of the period)...so this nothing but coincidence? plz tell me that's not the case!

this isn't the best example, but the only one i have on this computer.

i find them handy in helping me spot patterns too.
 

Attachments

  • bad geometric example.JPG
    bad geometric example.JPG
    132 KB · Views: 153
thanks for the link tim. you've just freaked me out re the trendlines though!
Hi dr.blix,
I suspect that one of us has got the wrong end of the stick - probably me! There's nothing wrong with all the lines on your chart, especially if they work for you. I was merely responding to your comment about a child's drawing. My main point is that trendlines - be they hand drawn ones or moving averages plotted by computer software - are just that: trendlines. Lines of S&R are a separate entity and have nothing to do with trend.
Tim.
 
yes they do !
I'm not sure whether or not TBT's comment is in response to my assertion that trendlines are different from - and not to be confused with - S&R lines or not. Either way, for the benefit of dr.blix and anyone else who requires evidence from a higher authority than me (i.e. just about anyone!), I quote an extract from 'Trendlines 101', a chapter from dbphoenix's book. He explains things rather better than I do and with considerable wit. Note the paragraph in bold.
;)
Tim.

Looking at a chart on which no trendlines of any sort have been drawn is sort of like the burglary movies where the guy is trying to steal the big diamond that's sitting on a big pedestal in the middle of the room. He knows that there is an alarm which is triggered by the interruption of one or more of a series of laser beams which criss-cross the room. Unfortunately, he doesn't know where those laser beams are because they're invisible to the naked eye. So what does he do? He blows smoke into the room so that the beams become visible. Knowing where they are enables him to miss them and avoid setting off the alarm. Similarly, there are a variety of trendlines on your chart, even though you may not be able to see them. Blowing smoke on your chart will be of no help, however, so you'll have to be satisfied with a less-dramatic straightedge and pencil.

A chart is a visual representation of stock transactions, or the buying and selling behaviour of traders. The price points which represent those transactions can be plotted as a line (like on a heart monitor) or as a series of vertical bars (which show the high, low, closing, and usually the opening prices). The purpose of trendlines is to help the trader find order in all these price points and tell him whether price is going up or down (he could also ask a five-year-old to look at the chart and tell him whether price is going up or down, since small children have an uncanny ability to do this, but five-year-olds aren't always available). Trendlines will also help him find the best entry and exit points by supplying additional information about support and resistance.

In order to get the most profit and the least loss out of trendlines, you must first rid
yourself of the widely-held notion/conviction that trendlines provide support and
resistance. Understand that people will point at you and laugh if you attempt to discuss
this with anyone, but you will have a tool that they do not. And quite possibly the last
laugh.


"Support" refers to that point or level at which one can expect a falling price to stop, stall, bounce. "Resistance" refers to that point or level at which one can expect a rising price to stop, stall, or retreat. These are hypothetical rather than absolute because their existence and reliability depend entirely on human behaviour. And we all know how dependable and predictable human behaviour is . . .

Support and resistance exist -- or can be expected to exist -- because of trades completed at some point or level or zone. They can be weak or strong depending on the number of trades completed at one time and/or the number completed on multiple occasions at about the same price (these occasions can be clustered closely together, or separated by considerable lengths of time). Because they represent trades, they also represent all the fears, hopes, doubts, anxieties, and greed that went into the trades in the first place. If they've stored a great deal of emotional content, and if those emotions are in any way still raw, one can expect to encounter activity at those levels which is out of the ordinary. Sometimes extraordinary. And where one finds action, one also finds opportunity.

Trendlines, on the other hand, do not provide support and resistance (S/R) in and of themselves because they are always moving (ditto with moving averages and other
indicators). When they seem to provide S/R, it is only because that particular intersection of price and trendline is coincidental with previous S/R. Anything else is a random occurrence (if this quakes the foundations of your universe, examples will be provided later). On the other hand, trendlines, drawn correctly, do what they're intended to do quite well. Used properly, they are an excellent tool, but one shouldn't expect them to perform a task for which they are not suited, anymore than one would try to drive a nail with a screwdriver.
 
sorry my post was a bit lacking in detail tim


"S&R are a separate entity and have nothing to do with trend"

yes they do !
 
"Either way, for the benefit of dr.blix and anyone else who requires evidence from a higher authority than me (i.e. just about anyone!), I quote an extract from 'Trendlines 101', a chapter from dbphoenix's book"

I am sure it is a very good read Tim, but its not a higher authority or evidence of anything imho

individuals should carry out their own research and come to their own conclusions on everything
 
Last edited:
I do agree with tenbobtrader, Timsk.

I have no evidence that anyone who posts here, especially me, is on a higher plane than anyone else.

All we can do is give our opinions on certain subjects and hope that it helps someone along the way.

SR lines are all over the place, at all levels and all timeframes. I despair of getting the right one and, even then, they are only zones, approximations of areas that might, or might not be pierced. So what do we do--- buy 'em or sell 'em? What helps us decide? A good old trendline helps me.

If I have a TL that persistently spots the high point of downtrends I use it as much as an SR line. People do put their stops there- as they do with strong averages.

All of these lines don't work much better that any horizontal line drawn at random in a trending market.

This is very low level stuff, worm's eye level, in fact and its just meant to be an observation that we all know something which, no matter how small, may help someone else become a better trader.
 
this is pretty good imho regards trendlines (the diagonal ones)


Trend lines, to me, are drawn arbitrarily. I just use them as a sort of "comfort line". If I am on the right side of it I feel fine and have no worries. The rule that they must be drawn across the tops or bottom is, more or less, telling the market what to do. How can you expect that of a price? When the price cuts the trend I look to see if a pattern is forming. If the pattern is continuous, I revert to a trend line, again, almost certainly, the momentum will have changed but if I keep to the right of it in a bear and to the left of it in a bull then I am OK- Whenever it crosses, it is a warning to pay attention to the trade, nothing more.

There is nothing to be learned from trend lines, IMO anyway, except to help keep the ship on course. Go inside it and you are entering into shallow water.

Watch the trend line but remember that deep sea men don't like shallow water. Neither do coastal men like deep water.

BY

Split


just a thought regards trendlines and sma,

not done any real research on cause or anything ~

anybody noticed if you apply S & R lines, trendlines and sma"s etc etc to most charting software how price data sort of unscrunches itself when they are removed later and gives a whole new look ?
 
"SR lines are all over the place, at all levels and all timeframes. I despair of getting the right one and, even then, they are only zones, approximations of areas that might, or might not be pierced. So what do we do--- buy 'em or sell 'em? What helps us decide? A good old trendline helps me."

how strange

I post an old Split post and you post just before me Split

....... Deja Vu :)

good post Split
 
I wrote that a while back!

I have changed my view a little, since then, If a TL is tested more than once I get the impression that a lot of people are using it to enter the market, so I may use it, too. Any successful turning point is as valid a place to enter a trade as an SR line. The whole thing depends on probabilities and the risk that you are willing to accept.

As for importance, a Jack Schwager comment I read once, and always remember, said that " A failed trendline is far more important to him than most other signals.
 
Thank you for your responses gentlemen, although I'm a tad confused as they seem to support my belief that trend is trend and S&R is S&R. They are two separate entities with two different functions. Yes, they coincide from time to time and those traders who observe such a union may be able to profit from it. I'm happy to be persuaded by logical, reasoned argument that trendlines are also S&R lines, but I've yet to see any. A good start would be if someone can explain to me:
A. How the market knows that I'm using a 10 period MA on my charts, Split draws his in by hand along the open/close, Tenbob uses a 21 MA, Tom draws his in by hand along the high/low and Jon uses a 35 MA etc. etc. Multiply that by thousands and it's obvious (to me) that price 'bounces' at trendlines is pure coincidence and nothing more.
B. Even if the market does have some magical way of knowing how each of us adds trendlines to our charts, isn't it a tad arrogant of us to imagine that the market is either going to respect our trend lines to please us, or breach them to wind us up?

The market doesn't know or care where each of us places our trendlines. How can it? But it does care about the levels at which participants engage their emotions and experience fear and greed. Why? Because 'the market' is us and, as human beings, emotions are the common denominator that unites us all and transcends language, race, intellect, religion, geography - the lot. Think in terms of emotions and it will make my viewpoint easier to understand, even if you don't agree with it. There is plenty of collective market emotion attached to a properly drawn horizontal S&R line. There is none at all attached to a randomly drawn diagonal trendline that appears in different places on each trader's chart based on their understanding and perception of the market.
:p
Tim.
 
Tim

re-read previous posts please

nothing we posted supports you or the conclusion you have drawn from reading them

"emotions are the common denominator that unites us all and transcends language, race, intellect, religion, geography - the lot. Think in terms of emotions and it will make my viewpoint easier to understand, even if you don't agree with it. There is plenty of collective market emotion attached to a properly drawn horizontal S&R line."

"There is plenty of collective market emotion attached to a properly drawn horizontal S&R line"

even I am not that emotional !
 
even I am not that emotional !
Hi TBT,
Given our recent communication via PM - there is quite a lot I could say in response to this comment, but that would be grossly unfair and unethical - so I won't!
;)
Re. comments made by you that supports my argument - here are a few:
Trend lines, to me, are drawn arbitrarily. I just use them as a sort of "comfort line".
Precisely my point! Where you draw them is different to where I draw them, to where Tom draws them etc., etc.
The rule that they must be drawn across the tops or bottom is, more or less, telling the market what to do. How can you expect that of a price?
Again, exactly my point. Of course we can't expect the market to behave as we would like it to or want it to!
When the price cuts the trend I look to see if a pattern is forming. If the pattern is continuous, I revert to a trend line, again, almost certainly, the momentum will have changed but if I keep to the right of it in a bear and to the left of it in a bull then I am OK- Whenever it crosses, it is a warning to pay attention to the trade, nothing more.
Agreed. You've described very well what trendlines are and what their purpose is. If price is above the trendline (in an uptrend), the market is bullish and if price has breached it, that's a sign that the current trend is faltering and the market may be about to change. Bu88er all to do with S&R!
Anyway, we've expressed our respective positions on the subject, so let's agree to disagree and draw a line under the matter. Subscribers to the thread can make up their own minds as to which of us is talking sense!
:cheesy:
Tim.
 
but trend lines aren't drawn arbitrarily, they're drawn linking price pivots.

the way i understand it is, S&R gives a reading on the Y-axis. time on the X-axis, with price on the Z.

price is just a trend line surely? it plots the rate of movement on the Y-axis. a trend line based on price is just a mirror (albeit a cloudy one)...so i would have thought non are exclusive?

i am new, obviously, so i appreciate all the shared views.
 
Last edited:
Trying to resist adding my support.
Sorry, that was a very average line (but strangely moving).

Oh blimey, its been a long day.
 
I don't think that there are any valid definitions for any lines, horizontal or slanting. I come to my own conclusions. Have you ever noticed how lines drawn on the chart grafic lines,ie. 4210, 4220, etc serve much the same purpose as any SL or Fib lines? I think that they do, anyway.

Innumerable books have been written on this subject but they only reflect the author's theories, or he repeats those of others. The fact is that, in this part of trading, your ideas are as good as anyone else's. The money is made and lost in being correct in direction. IMO SR lines do not give an indication of probability of direction, trendlines do--- for me, anyway. For one thing, once the TL can be drawn, a new direction is underway. The same can be said for averages, which is why I am a trend follower, more than someone who tries to spot the turns.

I'm sticking my neck out, I know, because SR lines are loved by posters on all sites. Good job that we are all different. :D

To answer Timsk's "A". The market does not need to know what averages the traders are using. It just keeps going up through all of them in a pullback, until all the stops have been triggered. The sellers will turn the market back when they are strong enough to do so.
 
fire away boy, the floors all yours

Hi TBT,
Given our recent communication via PM - there is quite a lot I could say in response to this comment, but that would be grossly unfair and unethical - so I won't!
;)
Re. comments made by you that supports my argument - here are a few:
Trend lines, to me, are drawn arbitrarily. I just use them as a sort of "comfort line".
Precisely my point! Where you draw them is different to where I draw them, to where Tom draws them etc., etc.
The rule that they must be drawn across the tops or bottom is, more or less, telling the market what to do. How can you expect that of a price?
Again, exactly my point. Of course we can't expect the market to behave as we would like it to or want it to!
When the price cuts the trend I look to see if a pattern is forming. If the pattern is continuous, I revert to a trend line, again, almost certainly, the momentum will have changed but if I keep to the right of it in a bear and to the left of it in a bull then I am OK- Whenever it crosses, it is a warning to pay attention to the trade, nothing more.
Agreed. You've described very well what trendlines are and what their purpose is. If price is above the trendline (in an uptrend), the market is bullish and if price has breached it, that's a sign that the current trend is faltering and the market may be about to change. Bu88er all to do with S&R!
Anyway, we've expressed our respective positions on the subject, so let's agree to disagree and draw a line under the matter. Subscribers to the thread can make up their own minds as to which of us is talking sense!
:cheesy:
Tim.

Tim

that was a post made some time back that describes the use of a trend line and Splits personal view of them at the time

I agree with that post

so we agree on trendlines :)

they are complete BS and the eye ball works just fine

The bit we disagree on is ~

"S&R are a separate entity and have nothing to do with trend"

imho they are connected and your post is a touch misleading, thats all.

not sure we do disagree, you just have not made it very clear Tim

regards ~

"Given our recent communication via PM - there is quite a lot I could say in response to this comment, but that would be grossly unfair and unethical - so I won't!"

sounds like a threat

my name is Andy

former T2w member ~ develbis, blackbear, pinkpig, bladerunner and SEMM

think thats the lot :)

I failed at intra day trading full time, I have full journal documents of every trade taken for a period of 1.5 years

I traded in profit for much of the time and was let down by my inability to cope with the sustained pressure which resulted in loss on account balance and an increase in unforced errors outside my method rules

The emotional errors were exaggerated by my lack of exact preperation and failure to anticipate what the market can do to you if you are not fully prepared

I have a fully developed method that is far better than me, my ability to trade it as per my own written instructions is effected to this day

I have become absolute risk averse and can only trade with very small stakes, even then the symptoms persist

by even bringing up a private pm up in a post you prove yourself to be grossly unfair and unethical

say what the F..ck you like mate

Fire away!

sure I will learn plenty from a guy who cannot define failure in the absolute sense and includes an unplanned FX trade (account funds held in dollars) to protect his ego and pride against an admission of loss

Andy
 
Hi Andy,
Judging by your last post, it's obvious that I've caused you offence, for which I apologize unreservedly and I assure you was not my intention. As the 'debate' about trendlines Vs S&R lines has clearly swayed into personal territory, I don't think anything useful will be served by my attempting to address your comments, as experience tells me that such action tends to inflame a situation rather than to diffuse it. So, let's call it a day shall we?
:love:
I will respond to the comments by dr.blix as he's raised an important point that deserves clarification and the issue of trend and S&R is an important one that affects us all.Tim.
 
To be a money master, you must first be a self- master

Tim

BE is always a good result :)

sure you can imagine problems encounted by myself given my natural emotional personality during the odd bad session !

To be a money master, you must first be a self- master

by

J P Morgan
 
Glad that you two are getting along.

You are a bit prickly, Andy. You must keep that trigger finger on the trading platform.
 
support my belief that trend is trend and S&R is S&R. They are two separate entities

sorry my post was a bit lacking in detail tim


"S&R are a separate entity and have nothing to do with trend"

yes they do !

Thank you for your responses gentlemen, although I'm a tad confused as they seem to support my belief that trend is trend and S&R is S&R. They are two separate entities with two different functions. Yes, they coincide from time to time and those traders who observe such a union may be able to profit from it. I'm happy to be persuaded by logical, reasoned argument that trendlines are also S&R lines, but I've yet to see any. A good start would be if someone can explain to me:
A. How the market knows that I'm using a 10 period MA on my charts, Split draws his in by hand along the open/close, Tenbob uses a 21 MA, Tom draws his in by hand along the high/low and Jon uses a 35 MA etc. etc. Multiply that by thousands and it's obvious (to me) that price 'bounces' at trendlines is pure coincidence and nothing more.
B. Even if the market does have some magical way of knowing how each of us adds trendlines to our charts, isn't it a tad arrogant of us to imagine that the market is either going to respect our trend lines to please us, or breach them to wind us up?

The market doesn't know or care where each of us places our trendlines. How can it? But it does care about the levels at which participants engage their emotions and experience fear and greed. Why? Because 'the market' is us and, as human beings, emotions are the common denominator that unites us all and transcends language, race, intellect, religion, geography - the lot. Think in terms of emotions and it will make my viewpoint easier to understand, even if you don't agree with it. There is plenty of collective market emotion attached to a properly drawn horizontal S&R line. There is none at all attached to a randomly drawn diagonal trendline that appears in different places on each trader's chart based on their understanding and perception of the market.
:p
Tim.

from another thread ~


"Originally Posted by timsk
Hi Tickdoc,
Typically, trading ranges separate trends. The trend up from early March has been a full 1,000 points from 3,500 to 4,500 which the index hit in early May. Since then, it has been rangebound, making no less than 5 attempts to breach resistance at 4,500 - all without success. The bottom end of the trading range at 4,300 is old resistance from February. As you know, this was breached yesterday with no evidence of a fight from the bulls. So, there's ample evidence to show that price can't go up, so it follows the path of least resistance (to borrow a line from Livermore) which is down. If a new trend is to be born out of the trading range, then it looks like being a down trend as things stand. Also, if you use Bolly Bands, you'll note that price is beyond the low deviation following a particularly tight Bolly 'squeeze'. All in all, it's pretty bearish behaviour. How low will it go? I've no idea (there's a surprise lol) but, technically, there isn't really anything that I can see to prevent price from waterfalling all the way back to the March lows. Lovers of round numbers and Fib' levels will, I imagine, be looking carefully to see if price finds support at 4,000 - the 50% retracement level. I will be to.
Hope that goes some way to answering your question!
Tim."

Good post

the range you describe in the day timeframe exists within a larger timeframe or within a timeless p&f enviroment does it not ?

that price rotation with its own valid S & R zones / locations is a pretty small price action affair when higher timeframes are taken into consideration

imho they are connected

a diagonal trendline could be of use to many

"two different functions" = explain please so I do not get to emotional regarding your response :)

think the subject of value to many so worth continuing on a Swing the Ftse thread

Andy
 
Last edited:
Top