Hi F,
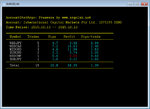
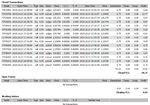
I targeted 20 pips today.
Actually using 4 LR's : 8+12+28+37
All KT drawn by advance on the chart from 0.00/1 to 23:51
Also using dynamic Support and resistances calculated from M30 timeframe
Watching 8 majors: GU + NU + EU + AU + UJ + UC + EJ + UCh.
Of course it's a demo account.
ATM I'm absolutely unable to catch trades bigger than 1.5 pips, it's too scary...
I was also probably lucky; time will tell...
It's the first time I post attachment, hope I did it OK ....
Regards.
R.
Hi R
First of all
Well Done - you made a profit and although it took a lot of trades - you made your 20 pip target
I do know what you mean - about scary with quick movements
What does happen over time - ie months of trading on a 1 min chart - it then becomes slow and maybe how a 30 min or 1 hr chart looks to you atm
You actually adjust to the speed - its takes time and that why so many traders prefer the comfort of a 1 hr or 4 hr chart with large stops - they dont want the fear and hassle of so called "noise" - ie movements under 7 or 10 pips
By trading with tight stops - and you did well your bad trade you got out quickly - you are able to make RR winning trades of above 2 or 3 with just 12 -15 pips and what will happen some days as you progress you will catch many 10+ pip trades - all within just say 4 - 15 mins
Ideally never let a winning trade with over 5 pips of profit go to a loss - but if you are lucky to catch a real mover - check out the UCad or EA this afternoon - then once you are up 20 or 30+ pips you dont mind 7 -10 pip pullbacks etc
I personally think that's an excellent start - even though you might feel it was more luck etc
Remember even Sun has now taken over 1300 scalps - after you have done a couple of hundred scalps - you will get the feel - and adjust to the method.
Look forward to seeing how your chart looks
Also check out your settings on the EA at say 2 30 pm and after 4 pm - just to see if the 4 Lrs would have kept you with 50+ pip moves
👍
Regards
F
PS - Forgot to point out - ideally you need to get the interim static S & Rs from a 1 min or 5 min chart - 30 min chart will only catch the larger levels
Also for dynamic S & R levels use trendlines from interim lows and highs but you will find a static level / horizontal level should be stronger than a dynamic level - that after all is continually changing etc
Will find some examples out for you tomorrow


