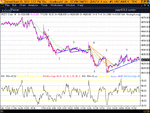
Now, I know that we're all not very long term, but it helps to keep things in perspective. The chart below shows how I have seen the s/r for the last few months. The recent break spells bad news for longs (including me) - Although lets not forget that technicals can only guide. In Farley he highlights good Bollinger techniques. i.e. upper band shows strength, lower weakness. Obvious stuff you say - well maybe
You are using an out of date browser. It may not display this or other websites correctly.
You should upgrade or use an alternative browser.
You should upgrade or use an alternative browser.
Tubbs
Interesting chart, I use bands as well however it is only 1 tool I use and it is important to be aware of other systems to see if they match. Personally I feel in the short time there is more downside especially as 4050 has been broken (on futures) and we are now playing the 4000 - 4050 range. I think we are currently seeing a correction of the long rise so there is some payback and would look to a similar move down this time with that of just above 4200. An important point already raised is the fact that we have broken out of the bottom of the rising channel and have failed to get back in.
EW followers will be looking for at least 1 wave down if not more. I would also consider a flag pattern on your chart and that this could be the start of the second stage, but that is just guess work at this time.
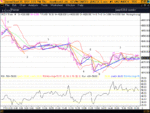
Anyway here is my take on today using trendlines from the 2 and 5 min charts. I think 40 - 50 points were on offer.
Bonsai - had cash chart up today against that of the Futures. I def agree with you the cash chart is much softer and less movement in the price bars making it easier to follow.
Kevin
Attachments
kevin
dont much like those trend lines you are drawing on your chart.
not if they are meant as trading signals anyway.
they seem to be all over the place and drawn in a random fashion.
if you are drawing them manually, perhaps you should mark
exactly where you are proposing to go long or short ?
the chart also looks very cluttered to me as you have so many
indicators on the go.
not sure how to elaborate.
the current fib is 4219/3952 at 38%
in most cases it is a matter of picking highs and lows but
with the one stipulation that you use elliott waves to determine
which highs and lows.
in many cases they are obvious but when you hear people saying
fibs dont work, its worth checking whether they are using the
right points.
elliott proposes that each wave will correct itself before moving
on.
but fibs are like trend lines, they can be made of glass and break.
its really up to the traders who move the markets.
If they have finished buying then the market will fall back. If
not they have the big pockets to push through resistance.
But they work often enough not to be ignored and are better than most indicators.
Does that help ?
Thanks Bonsai, it does help in a way. Maybe if you could post the most likely fibs now and again - I think you already do. On the subject of s/r lines they are discussed in great depth in the Master Swing Trader. Basically the more times you hear a support number - for example fib line/trend channel/bollinger band - and they are around the same area the stronger the usage. He calls it cross-verification. I think it's quite important - albeit obvious.
On the subject of technicals I can't help feeling a little smug on the pos divergence that developed yesterday.
Once again, thanks for the quick reply
On the subject of technicals I can't help feeling a little smug on the pos divergence that developed yesterday.
Once again, thanks for the quick reply
Firstly Bonsai - I have my capital tied up in a very bad trade - using a levered covered warrant that went wrong -I have to get a decent exit point, around 4090/4100. After that I will never hold an overnight position again. The problem will intraday divergences is that you never know when they will reverse of if indeed they will - I think that Japan had a big hand in today's market.
Be-positive - I use the same charts - live and I think they're great. If you follow the advice from BONSAI in a previous post you can automate the refresh process and it gives real updated charts
Be-positive - I use the same charts - live and I think they're great. If you follow the advice from BONSAI in a previous post you can automate the refresh process and it gives real updated charts
be-positive
Veteren member
- Messages
- 4,969
- Likes
- 488
bonsai---- jonnyy40
so sorry 😱 😱 😱
:arrowd: 08-07-2003 10:37 PM http://cchart.finance.lng.yahoo.com/z?s=^ftse&a=v&t=1d&l=on&z=l&q=c&i=uk
bonsai
this looks a nice clean chart ?
---------------------------------------------------------------------------------
08-07-2003 11:40 PM
The chart has a nice sharp image for identifying the trend and it's changes and continuation. I would need a lower indicator for back up for early reversals but the clarity is very good.
The big question, is it available in real time like this or as I fear 15 mins delayed.
Kevin
Just copying your chart from 08-07-2003 10:37 PM and adding kevin546 indicators
Last edited:
tubbs
covered warrants ?
courageous, innovative, original, imaginative ?
Sir Humphrey Appelby's comments on what he thinks is a bad
idea !
(not exactly a trade in line with your profile ?)
if I remember there are very few market makers in warrants, so
they probably have you by the balls (and many others too).
best of luck
Similar threads
- Replies
- 478
- Views
- 70K
- Replies
- 808
- Views
- 102K
- Replies
- 197
- Views
- 33K


