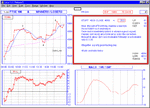
FTSE 100 intraday trading - JULY 2003

  • Thread starter Thread starter bonsai
  • Start date Start date
  • Watchers Watchers 6
kevin
if that really is your 'system' which you intend to trade when
you give up your day job then let me give you a piece of advice.

keep the day job.

With that much detail and clutter on the chart you wont be able
to see what is actually happening and unless you draw your
trend lines properly and in the right places you wont know
whether to accept them as useful or not.

Frankly your 5 min chart looks to me as though its something you
have thrown together rather too quickly after the event and
without real study of the detail. And on that basis is unlikely to be
workable in real time.

You may think this is being negative about what you have done,
but that is not where I am coming from. I am trying to help you to
recognise the flaws. Trading real time is front line stuff and the
enemy does not take prisoners.

It is still true that 90% of traders get blown away and its happening every day.

But its up to you.
 
Heh - calm down, calm down. In my opinion you're both a two extremes which I would prefer to be in between. Line charts can be a bit simplified- and trend lines everywhere can be confusing. As long as everyone's happy that's all the counts - that and sharing a bit of trading methodology. I think Bonsai is right however that too many trendlines can ruin a trading account.
 
"[So your esteemed opinion is the second strategy is 'stupid' because it's the equivillant of been flat in the market- but surely if your not in the market that's the position you'd be in anyway." Precisely......but if you are not in the market then you have not incurred any cost , so the positions are not equivalent


"If you find it easier to close a position than open one- I cannot see the problem- especially at times of indecision."

You sound like the sort of guy who pays more than he has to because he feels better doing it that way. Totally illogical

£3pp on the Dow giving the spread away both sides makes you down £ 30 @ any given time you are £ 30 maximum down.

Surely been in the market at a time of indecision is worth the £30
especially if it's pulling the trigger to get in the market is your problem. On the loosing trade- you can have the ticket set up for a reversal trade eg. buy/sell 6pts.

Haven't traded this strategy- but will probably try it out on £1pp on the UKX.

Iam making a regular income out of D4F, week in week out, so no worries on that score. 😉


QUOTE]Originally posted by bonsai
waqr
if you were making enough money trading to pay tax, dont think
you would be asking that question
lol

lets just say I've got some losses to work off

Sorry to here your trading strategies are leaving you in negative equity, not the case at this end
 
Bonsai

As I posted previously WE ARE ALL ENTITLED TO OUR OPINIONS. You are commenting on a chart that that you clearly do not fully understand. Of course the finished article is cluttered but you are not breaking it down. I have posted in this fashion in order to present the complete day and to try and show what deals were available through such a method. I am therefore displaying more detail than your own chart which is of course a different approach entirely.

As for your advice which I hope was well intentioned but in view of the tone in your recent posts to me I now doubt. It is clear to me from your own comments that you cannot understand or open your mind to such an approach therefore your blunt comment. For this reason your comments based on this chart without constructive thought as an experienced trader come across to me as both naive and if not this then arrogant. This is not a case of my willing to take on board good advice or closing my mind to any criticism given by another. You are simply undermining a proven charting theory in its most basic form and that I cannot accept from someone who purports to be experienced. Moreover I have traded this and know what the chart looks like as it develops and how to trade it. I could understand you stating that the chart was cluttered but to dismiss the system so lightly give rise to my suspicion that your intentions are not so well intended, particularly in light of your recent posts.

When in real time there are not all of these lines because you are only working with the current one at that time. Placing a trade according to the most recent data and then moving on from this position. All I have done is produce the trends for the day otherwise I would need to post a chart for each signal. I assumed that this would be easy to see to a seasoned trader.

The system that I am applying is not new and cannot be called my own because it is exactly how trendlines are meant to be applied according to the charting books I have read which includes Murphy who is supposed to have produced the charting bible. If you do not believe then read up on the use of trendlines and you will see that each line represents the true confirmation of a trend change. Consider what is called a tentative trendline break and a confirmed trend change. All of the lines I have drawn meet this requirement and display it in the varying degrees that trendlines are formed. You know the 3 different time frames, long, intermediate and short. These time frames can be introduced to intraday charts just as they can for historic ones.

So thanks for your advice but I think I will go with my own research and proven trendline theory. I will take this opportunity to post my thanks to your earlier posts in response to my questions which were frank and honest but of late I have found your tone both snide and bordering on the rude.

I will not post again. I wish all good luck but it is clear this thread is no longer benefiting me when I feel compelled to post like this. and it is not helping others. As this is your thread I will do the Honorable thing and leave you to it and will not post again.

Kevin
 
Yes I am sure we all know some 😈 ( dartsab :arrowl: )somewhere :cheesy: :cheesy: :cheesy:
 
Last edited:
Kev,

Hi,

Yer need a stronger back bone than that my friend- everyone is entitled to his or her opinion & we all see things slightly different-
Bonsai is calling it from his seat & is trying to be constructive in his critisism.

If you're convinced that you've got it right- stick to your guns- keep posting- keep trading & be happy. No need to take yer bat & ball home.


Remember.

A man that thinks the same at 60 years of age , as he did when he was 30 has wasted 30 years. Ali Muhammad ( The Greatest)
 
somewhat later than usual but here is my summary for friday.
Ftse back to its nice gentle swings made it a happy day for some ?

With the new low first thing, and immediate rejection, we do
need to consider whether we have now seen the end of the
correction and the start of a new rally to a high above 4219.

There are one or two pointers in that direction, nothing stronger
than that and the market can make nonsense of any forecast
very quickly.
But keep it in mind ?
 

Attachments

  • jul11.gif
    jul11.gif
    21.9 KB · Views: 352
In trading all that matters are results. If someone is consistently making profits then who are we to tell them that their method of trading is wrong ?

Lockstock:

A man that thinks the same at 60 years of age , as he did when he was 30 has wasted 30 years

Doesn't this depend on how they think at 60 years of age as opposed to 30 ?

If at 60 they think negatively are selfish, cynical and not open to new learning but at 30 were positive, open to learning and optimistic then they would still meet the above criteria but in my view would still have wasted 30 years.


Paul
 
Thought for the week.

ALL INDICATORS ARE ILLUSIONS.
How many illusions can you cope with ?

The illusion may take the form of Elliott waves, RSI divergence,
MACD signals, Stochastics or whatever.
The truth is that none of these mean anything.
That is not to say the signals are false,but they will only be correct
on a statistical bsais,i.e they have no meaning.
They are only useful as long as the market concurs by its action.
Once it stops doing so, they are worse than useless.

And in practice they are used merely as an entry mechanism.
Entry is the easy part, it doesnt matter how you enter, its how
you exit that is counts.

Many traders get hooked on the illusion and lose out because
they cannot see it has become meaningless.

Successful traders stay with the trade only so long as it fits their
criterion, once that stops, they are out !

That is the key - entry is largely irrelevant,,,,,,
Understand that and you are on your way.

John Piper
 
Bastille Day
apparently, when they stormed it, there were only 8 people in it.

Diary for the week. Copy and Print ?
 

Attachments

  • diary.gif
    diary.gif
    28.3 KB · Views: 323
nice run up so far ?
I have a resistance line running from 3952 and under the lows.
now at 4088
 
waqr
dont think so, well not in my vocabulary
its use as a support line was lost when we crashed through it on
thursday.
the only use for that line is if it now provides resistance
when we get there ?
 
bonsai,

didnt realise you were looking at previous support, the intra day highs on 6th and 9th at 88 and 86 are also significant but the real issue is the futures levels at 80 and 95 and 100 [the cash chart will follow the futures market]
 
I agree
its a pretty obvious problem area.
and the whole trading world can see the problem ?
especially as we have a gap open.

I also agree the cash USUALLY follows futures.
(and the futures USUALLY follows the dow.)
 
waqr
yes, if I suggest a support line then you can always draw it under
the lows.
but if I talk about a resistance line then you can always draw
it through a break of support.
dont often use flat lines as they are usually self evident.
but will instead talk about failed retests or breakthroughs etc.

edit
this whole area is quite dramatic. Not only do we have my
resistance line but there is also a fib line from 4219
and we are right on the lower channel line.
and we have 2 previous attempts at breaking higher.
phew ?
any break could be worth trading !
 
Hi guys,
Question: if the bank sector rises that pulls up the FTSE cash,which in turn leads to futures rising.Or is it the FTSE futures rise,which leads buyers into banks to raise FTSE cash.
Which comes 1st?

Thanks
Steve
 
Yep ! USA rules !

Just read Sunseekers latest opinion on the S&P, seems all are bullish, would be nice to see a false break above the 4100 level
 
Back
Top