You are using an out of date browser. It may not display this or other websites correctly.
You should upgrade or use an alternative browser.
You should upgrade or use an alternative browser.
It's almost a pity the weekend's here -- I'd like to know what happens next.
jonnyy, that is an absolute classic.
your best yet !
😆 😆 😆 😆
Bonsai.
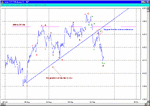
Have looked at your chart and like it. I dont use elliot waves as such,but have worked out a target based on fibb patters and my target is 145 to 130 and we are very near that,so I hope for a bounce in the short time.
What range are you working with to get 50% at 4280?.
Bonsai,it would be great if you would produce this chart every week end,hope you can.
LOL.and keep out of the horse road.
Bonsai
Your chart is really interesting. I have Frost and Prechters book and also "Fibonacci Applications and Strategies for Traders" by Robert Fischer. I must admit I find them hard going. I presume like most things in trading it takes time and practice to be able to apply the principles. I believe you also trade individual shares. Do you do that purely on their charts or do you also take into consideration what the FTSE is doing? I trade a share portfolio for my son. As it is through a broker I need to allow for their commission etc. I am back in cash at the moment looking for a decent retracement of the FTSE. Would you wait until we appear to be back in an up trend or trade shares on their individual support levels? I hope you don't mind me trying to pick your brain, but you are obviously very successful.
Thanks.
Jean
. I believe you also trade individual shares. Do you do
that purely on their charts or do you also take into consideration
what the FTSE is doing?
Yes, I trade (FTSE 100) stocks almost entirely on their charts, but
one of those charts is their FTSE Relative. A lot of movement in
FTSE stocks relates to ROTATION and it always helps to pick
stocks whose relative is in a rising phase.
I think it follows that if you can pick stocks whose relative is rising
while FTSE is also rising then you wont go far wrong.
I am back in cash at the moment looking for a decent
retracement of the FTSE. Would you wait until we appear to be
back in an up trend or trade shares on their individual support
levels?
A great deal depends here on your trading style and what length
of trend you have in mind.
If, as your question implies, you think FTSE has now broken its
trend then you may find that individual 'support' levels do not
work well.
Bear markets tend to rip through support as everyone joins the
rush to sell.
So it would be 'wiser' to be happy that FTSE has found support
and is once again climbing before taking on too many position
trades.
On the other hand, if you are happy that the trend has been
broken and FTSE has not found real support then shorting the
pull backs on individual stocks is the way to go.
It all sounds simple ?
The messy bit as always is, "How do you assess whether the
trend is up or down "
I am sure you have your own rules, but watching to see if stocks
are still responding to their support levels can be an important
part of that assessment.
For my own part, I am not yet convinced that the high on FTSE
is yet in. The sudden rush of blood to its feet in the last few days
may be the start of something but may also be just the result of
a temporary bull consensus as many commentators have recently become bullish.
I hope this helps, but I fear it may not.
Last edited:
Similar threads
- Replies
- 866
- Views
- 112K
- Replies
- 478
- Views
- 70K
- Replies
- 808
- Views
- 102K

