You are using an out of date browser. It may not display this or other websites correctly.
You should upgrade or use an alternative browser.
You should upgrade or use an alternative browser.
Sledgehammer
Member
- Messages
- 75
- Likes
- 0
" the directors have made a decision to close the company"
Bonsai - Just noticed you`ve changed your MACD on the first page. It looks OK to keep anybody on the right side of the market. I`ve only ever tried it on the D4F prices. After beating myself up after my first trade I am trying another one. Sold at 10.12 @ 30. Doing OK at the moment.
hungrybear
Active member
- Messages
- 209
- Likes
- 0
Just got in to see there's been strong rally today. I thought it would come up a bit, but not that strong. Opened a short at 4124....
hungrybear
Active member
- Messages
- 209
- Likes
- 0
Closed Ftse at 4106. Obviously too early, but a reasonable +17 after commission
be-positive
Veteren member
- Messages
- 4,969
- Likes
- 488
Would that be the fib at 16 :?:
hungrybear
Active member
- Messages
- 209
- Likes
- 0
Took another 11 points on that drop. Think I'll wait for a retace for the next short. Still expecting a low tommorrow
hungrybear
Active member
- Messages
- 209
- Likes
- 0
bonsai,
All the markets have now broken their long(ish) term lower tren-lines. I'm still expecting a wave C down, probably into mid-August or later. If there is another drop tommorrow as I expect, we should then see a bounce for 2-3 days.
All the markets have now broken their long(ish) term lower tren-lines. I'm still expecting a wave C down, probably into mid-August or later. If there is another drop tommorrow as I expect, we should then see a bounce for 2-3 days.
Bonsai
I hope you enjoyed your swim and drink?
Just a quick one.
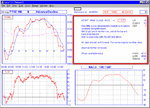
I like your I minute FTSE 100 chart. However, I can I expand the coverage to more than I day. I know I shouldn't tinker but I like to see a few days history of support/resistance. I have tried to spot the reference in the code line to the amount of price history exposed. You can e-mail privately if you want too.
Thank you in advance for your time.
Ride 'em cowboy ?
Early Goat as it pulled back through important fib level.
Topped out where there was clear chart resistance and more fib country.
Did you see my comment about futures expiry ?. Always worth
keeping your eye on that level particularly as the only times
we had previously broken above it were both sharp spikes
followed by sell-offs. (or should that be sells-off?).
Attachments
Similar threads
- Replies
- 866
- Views
- 112K
- Replies
- 808
- Views
- 102K
- Replies
- 197
- Views
- 33K

