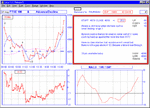
FTSE 100 Intraday trading - August 2003

  • Thread starter Thread starter bonsai
  • Start date Start date
  • Watchers Watchers 5
Take your advice on intraq-day volume, but my interpretation before placing my bet was that the down candles had consistently higher volumes than the up candles.

On any new trade i look for market confirmation of my entry. If market action confirms my entry decision I stay with the trade, otherwise i exit as predefined stop-loss points. Re adding to positions i made the first trade because I believed the trend might be changing. I make my next trade because I know the trend is changing (usually were the first correction to the trend resumes the trend again.) However, any second entry must be covered by the profit from the first entry, such that if I have to exit both trades I will at least breakeven. ie never turn a profit into a loss. (that's were the maths comes in!)
 
Last edited:
Now I know why journalists keep their commentaries brief.
It gets more difficult each day to select something appropriate
to say.
So, have a nice evening !
 

Attachments

  • aug7.gif
    aug7.gif
    22.2 KB · Views: 333
FTSE has a nasty habit of reversing the following morning just recently,after it has finished on the day's high/low and sucked everyone in.
 
morning
we had one gap above 100 now we have 2.

but this time we have a fib at 4109 protecting the high ground.
 
Last edited:
tough, but did you stop and reverse ?
if your theory didnt work this time, isnt that a
signal in itself ?
 
Maybe.It's been fairly consistant in past though,although as they say "past is no guarentee of future performance" !
 
C waves are nearly always stronger than you think.
and if its not a C then its a 3 which can be even stronger.

with the falling knife to 4046 the abc correction may be complete?
 
mornin' all

Been tinkering with a fib 50 range rather than exact number. On
the thought that intraday high/low extremes may be bull/bear
"testers" have used closing h/l prices and the usual h/l. Often
doesn't make much difference - my upper fib (now gone) was
around 4113 by both methods and the lower range 4060 -
4068. Will keep an eye on how it pans out and report back idc.

bonsai - seems a bit of steam in this move, are we up against
next resistance at 4130?

good trading

jon
 
FTSE quote been erased from my Bigcharts screen,now can't find to restore.Anyone have the code pls?
 
barjon
using the view that the abc from 184 is complete
I would expect resistance at 62%.
184/46/62%=131 !

however if correction is not complete I would expect
resistance at 172/46/62%=124 !
and it didnt happen.
 
Bonsai,
thanks,but is there a code.When I type 1805550 into my quotes page to store it doesn't recognise this.
 
did you put in uk: as well ?

and then you can add to their 'favorites'
at top of page
 
yes,I could add to favourites but not "my quotes" which I use as a homepage.Strange.Thanks,I'll keep trying to enter similar codes and see what comes up.
 
cant help then
I havent got a 'my quotes' option on that page.

edit
or are you talking about something in internet explorer ?
 
Last edited:
do you suppose the rally has anything to do with this ?
<img src="http://money.cnn.com/markets/morning_call/globex.png">

dont forget ftse futs expired at 147. It may be important.
 
Bonsai,
no,it's just you can select a favourite quote screen and store,but you have to enter code to add.
Interesting about futs.I have Sept TOR 4142
 
oh dear, I'm a nervous bunny today!

didn't enter 'cos of potential fib resistance @113 or after
that broke 'cos of potential resistance @ 130.

been waiting for a pull back but getting nervous about that
(if it comes) 'cos it's been such a strong, broad based rise
(W/L must look exceptional) on good volumes across the
board.

been looking at too much I guess!

good trading to you all - I think I might just sit this one out

jon
 
Back
Top