You are using an out of date browser. It may not display this or other websites correctly.
You should upgrade or use an alternative browser.
You should upgrade or use an alternative browser.
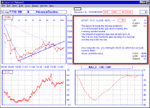
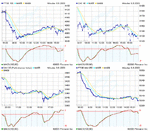
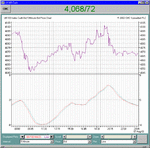
Does anyone know why Bonsai's 1 minute FTSE chart didn't record the first 13 minutes of trading. Have checked FTSE on bigcharts and they have the same opening gap. Because I couldn't understand how Dr Mike exited at 4094 this morning when the chart didn't record a level above 4090. Obviously that happened in those first 13 minutes of lost quotes.
mully
I expect Dr M was trading last night
see overnight graph.
edit
had a look at todays graph but cant see anything wrong.
(Page 1 ?)
<img src="http://chart.neural.com/servlet/GIFChart?sym1=ls:ukx&cbcku=FFFFFF&cbckl=EBF5FF&cbckd=cccc99&ctxtu=000000&ctxtd=000000&ctxtl=000000&csym1=000099&csym3=000000&cbckg=FFFFFF&cind7a=FF0033&cind7=009900&cind8=blu&cind9=6666CC&avg1=55&avg2=510&ind7=macd&periodMACDLow=100&periodMACDHigh=60&height=350&width=450&source=SP&multipane=1&watermark=splogoblue.gif&dres=min&plottype=range&ignore=1220025226&dperiod=days&coname=1&image=PNG">
Bonsai,
Look at the width of the 1st hour of trading and any other hour trading block. It is narrower. If you increase the size of the chart it is much more obvious as Bigcharts 1 minute day chart illustrates.
Anyway on to trading. I see your beloved gap is being rapidily filled. Where do we go from here? Wall Street was not the most bullish performance last night.
ok mully
I missed that
but the chart looks ok otherwise.
perhaps its a quirk of yahoo ? and will have correct proportions
later ?
edit later
teletext ?
channel4 ?
bbc2 has this
0803 4070.4 0.0
0830 4080.2 +9.8
0900 4078.9 +8.5
1000
1100
1200
1300
1400
1430
1500
1615
Wed 4070.4 -50.6
I missed that
but the chart looks ok otherwise.
perhaps its a quirk of yahoo ? and will have correct proportions
later ?
edit later
teletext ?
channel4 ?
bbc2 has this
0803 4070.4 0.0
0830 4080.2 +9.8
0900 4078.9 +8.5
1000
1100
1200
1300
1400
1430
1500
1615
Wed 4070.4 -50.6
barjon
Legendary member
- Messages
- 10,752
- Likes
- 1,863
Bonsai
do you consider the fib50 (around 4068 on intradays or 4062 on
closes) of the july low to high move to be out of play on your
once broken twice useless basis, or still in play on the basis
that yesterday represented a failed attempt to close under it?
good trading
jon
do you consider the fib50 (around 4068 on intradays or 4062 on
closes) of the july low to high move to be out of play on your
once broken twice useless basis, or still in play on the basis
that yesterday represented a failed attempt to close under it?
good trading
jon
Similar threads
- Replies
- 866
- Views
- 112K
- Replies
- 808
- Views
- 102K
- Replies
- 197
- Views
- 33K


