You are using an out of date browser. It may not display this or other websites correctly.
You should upgrade or use an alternative browser.
You should upgrade or use an alternative browser.
- Status
- Not open for further replies.
hungrybear
Active member
- Messages
- 209
- Likes
- 0
Morning,
Apologies for the irregularities of the posts at the moment. I'm working on swing trading as I dont think i have the right mentality for scalping. That's partly why most of my posts have related to predicting turns. So far it's working well and the last 2 days have yielded my best returns in over a year!
Current analysis suggests we are close to a swing low. It could have come yesterday, but Wednesday is the ideal day froma fib perspective so I'm expecting a drop tomorrow before we rally. This next rally is likely to be highly significant. No matter whether it's a new high or lower high, there will be a significant drop into December, possibly continuing into January. Although I do have a LT roadmap it has to be modified on an ongoing basis as the market path is defined. Currently it suggests a significant low In January followed by a rally into Aug next year. In the short-term I'm not convinced the Ftse has met it's upper price criteria for a significant high, but we should know within about 10 days!
I know many traders dont believe the market can be predicted, but this is working well for me and as long as it works I'd like to share it!
hungrybear
Active member
- Messages
- 209
- Likes
- 0
Hi Bonsai, yes fib time cluster and for an ideal turn a fib price point/cluster as well. Primarily working on the Dow & Ftse and using EW and Astrology support the anlalysis.
Just one quick post today as I have just got back from Hols and have become an Uncle this morning too...so off to the Hospital after a bit of shopping in Baby Gap lol..
Bit of a mixed picture on my charts...10 mins still says up at the moment to me but other suggesting down.Will take me a day to get back in the rhythm. Enjoyed reading Trading for a Living and Elliott Wave principle over the last week. Picked up a few new ideas and also caused me to question a few old ones. Think the EWP will take a good few reads. Its quite detailed.
Bit of a mixed picture on my charts...10 mins still says up at the moment to me but other suggesting down.Will take me a day to get back in the rhythm. Enjoyed reading Trading for a Living and Elliott Wave principle over the last week. Picked up a few new ideas and also caused me to question a few old ones. Think the EWP will take a good few reads. Its quite detailed.
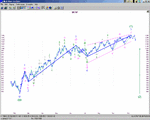
Here is a bit of fun. I have had Elliott Wave Analyser around for ages gathering space on my desktop. Thought I would run it for fun on the SP500 hourly chart. Make of it as you want, but do remember forecasting is dangerous to staying objective. However, I cannot resist the pretty picture. All thoughts welcome
Attachments
just back
hi hooya, did you have a good one. did you see the match ?
there is a rugby thread.
I see we have a battle of the trend lines ?
lol
think I am on the side of the break, then pullback, then break again and now attempting another pull back .
(a lot can happen in 60mins?)
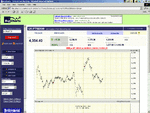
its just (but only just) possible that we have seen a 4th since the high today? (1 would have had to top at 4346?)
so the push for 4390ish could still be on.
on the other hand ..........
still the gap to fill above from yesterday by the looks of things?
Lucky for me Bonsai, it was raining on Sunday(messy game) so I got to watch it but the other half wasnt so please🙂 but the 5 days before were great weather so all in all pretty perfect. recommend it 100%
Lucky for me Bonsai, it was raining on Sunday(messy game) so I got to watch it but the other half wasnt so please🙂 but the 5 days before were great weather so all in all pretty perfect. recommend it 100%
mully
I think that may be a moot point.
we closed at 4339. so there has been no trading between
4339 and 4349.
I dont have any rules about whether that will get filled or not.
but if you go long, its worth having a tight stop.
I'm waiting for 1 hr to break above before I decide.
(Dax looks miserable)
I think that may be a moot point.
we closed at 4339. so there has been no trading between
4339 and 4349.
I dont have any rules about whether that will get filled or not.
but if you go long, its worth having a tight stop.
I'm waiting for 1 hr to break above before I decide.
(Dax looks miserable)
more interested in the gap to the upside
<img src='http://chart.bigcharts.com/bc3/intchart/frames/chart.asp?symb=uk%3AFtse+100&compidx=aaaaa%3A0&ma=0&maval=9&uf=0&lf=1&lf2=0&lf3=0&type=32&size=3&state=8&sid=123797&style=380&time=3&freq=6&comp=NO%5FSYMBOL%5FCHOSEN&nosettings=1&rand=2024&mocktick=1'>
<img src='http://chart.bigcharts.com/bc3/intchart/frames/chart.asp?symb=uk%3AFtse+100&compidx=aaaaa%3A0&ma=0&maval=9&uf=0&lf=1&lf2=0&lf3=0&type=32&size=3&state=8&sid=123797&style=380&time=3&freq=6&comp=NO%5FSYMBOL%5FCHOSEN&nosettings=1&rand=2024&mocktick=1'>
- Status
- Not open for further replies.
Similar threads
- Replies
- 478
- Views
- 70K
- Replies
- 2
- Views
- 3K


