barjon
Legendary member
- Messages
- 10,752
- Likes
- 1,863
bonsai - a dot every 2 minutes?
Now to candlesticks, hope my painting playing about works or
I'll be writing a lot for nothing.
Monthly
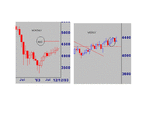
Thought you might be impressed with how well candlesticks
called the bottom with a long legged doji.
Otherwise the most notable feature is the narrow open/close
range each month over the last six months. This shouldn't
last much longer and a major break must be on the cards soon.
But which way? Well this months candle is a small shooting star
(not fully printed yet 'cos Nov not finished yet - I know but that's
computers) which is bearish unless the price action moves above
its high. If it does Fib50 resistance is in sight. If the action is down
a close below the shooting stars low will confirm bearishness, but
it may be too late by then if it's a major move 😆
Weekly
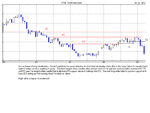
I've highlighted a stalled pattern (similar to the one I talked
about earlier on the daily chart) which led to a down week. This
week's candle is a bullish inverted hammer and we may continue
the 3 weeks up 1 week down pattern of recent months. On the other hand, action significantly below this week's low will be
bearish. Mmmm that sounds a bit "it'll go up or it'll go down" but
you catch my drift 🙂
Now let's see if these chart pieces come out...here goes


