You are using an out of date browser. It may not display this or other websites correctly.
You should upgrade or use an alternative browser.
You should upgrade or use an alternative browser.
- Status
- Not open for further replies.
mully
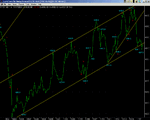
as your chart is hourly, I'm not sure if it will show
but if you redraw your trend line to include the down spikes
we seem to have broken through.
and are having difficulty regaining the high ground.
4348ish seems critical ?
mine starts at 4219.
as your chart is hourly, I'm not sure if it will show
but if you redraw your trend line to include the down spikes
we seem to have broken through.
and are having difficulty regaining the high ground.
4348ish seems critical ?
mine starts at 4219.
Last edited:
barjon
Legendary member
- Messages
- 10,752
- Likes
- 1,863
just returned from an investment group meet - just as well
I've been out given the action.
for your delectation and delight consideration included:
Longs: SGE on break through 190 which has been tested 8 times
CNE on bounce from 385-90
GLH after sustained gap break out of down trend
ICI island reversal followed by break out of triangle
Short: BARC on downward break of 484
AVZ continuation
Fluke,
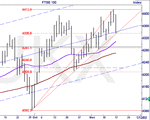
Interesting that you are showing another variation of data. You are showing 4082.2 as the low (4081.8) and 4413.8 as the high. I know it is splitting hairs, but I show 4412.9. My source is the FT who compile the data.
Anyway, what is 1 point between friends, but it does go to show that this process is more art than science and one should deal in probabilities/tendencies rather than exact number expectations.
Mully.
My main reason for posting the chart was to prove to myself that I have got the hang of it.
Also I am trying to keep up with you blokes and learning as I go.
Thought I would mention,I have just started to read The Master Swing Trader by Alan Farley.Have you read it Mully.
My main reason for posting the chart was to prove to myself that I have got the hang of it.
Also I am trying to keep up with you blokes and learning as I go.
Thought I would mention,I have just started to read The Master Swing Trader by Alan Farley.Have you read it Mully.
No I haven't.
Well done on the charting, as all contributions are very gratefully accepted.
It is amazing how easily one can miss things. or be blind because of bias. Yes I know I preach objectivity, but it is still easy to succumb to expectation/hope/wishes.
Well done on the charting, as all contributions are very gratefully accepted.
It is amazing how easily one can miss things. or be blind because of bias. Yes I know I preach objectivity, but it is still easy to succumb to expectation/hope/wishes.
Fluke, I am always on line (benefit of broadband)
For what it is worth I use the intra-day highs/lows with the all the caveats, that come from Market Profile, about using the least accepted prices.
Which is more accurate? Honestly, I do not know.
I use Fib levels not as absolutes, but to warn me where I might expect to see some reaction to price. But please remember nothing is valid until confirmed by price action.
However, I use Fibs in the context of where the overall trend is going. Old adage of going with, not against, the trend.
The real pro on this subject is Bonsai, I am just a student of the master. I am constantly trying to improve/learn. On going process.
Hope this useful.
Bounce yes and (depending on futures overnight) maybe
retest the sma.
However, because it looked like 336 may have been in play,
it also means 4411/4213 are also in play.
which of course means the whole rally may now be complete
until we spend a few days consolidating. Maybe 5 or 8 ?
So it could be we have seen the A of ABC.
if so, B might come undone anywhere but 4390 may be a good guess ?
The C wave ? C waves can be quite strong but pencil in 4310
or thereabouts.
Remember expiry was at 4297.
It's only one possible road map.
However first things first.
We could well make a low early on tomorrow despite the
quotes right now.
- Status
- Not open for further replies.
Similar threads
- Replies
- 478
- Views
- 70K
- Replies
- 2
- Views
- 3K


