You are using an out of date browser. It may not display this or other websites correctly.
You should upgrade or use an alternative browser.
You should upgrade or use an alternative browser.
- Status
- Not open for further replies.
barjon
Legendary member
- Messages
- 10,752
- Likes
- 1,863
bonsai
after your endless patience and 1 to 1 coaching (sufficient
to have made me a master trader had it been about trading)
T2W is still telling me it's not a gif file!! can't expect you to
waste any more valuable time on helping, but if you do have
any bright ideas........
jon
after your endless patience and 1 to 1 coaching (sufficient
to have made me a master trader had it been about trading)
T2W is still telling me it's not a gif file!! can't expect you to
waste any more valuable time on helping, but if you do have
any bright ideas........
jon
interesting week ?
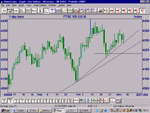
for the first time, it seems to me, we have first consolidated and then sat on 4280 which if you recall is the major fib 5282/3277/50%
previously we had broken through then failed to hold. But now it seems , support may be there if we ever need it.
There is a gap of course from this morning ...........
Something for the weekend, Sir ?
😆
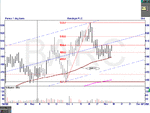
Here is a chart for the last two days as it may well cover the
whole of the move.
After finding support on my 50% fib at 4287, we have had a very nice move up to test the previous high.
One thing to note was the 'set up' at 1.30 on friday.
Hasn't happened for some time but seems clearly to have been about forcing a high to complete the wave count.
You do have to watch out for that sort of false break. The mm's love it.
Wave counts as you know are notorious for ambiguity and the
A/B/C which I have marked could also be 1/2/3 and therefore
more to come.
But either way, some correction was expected after the high.
Whether its just a 4th wave or the start of a more serious
correction, nobody can say. But as a minimum, I would expect to
see and abc shape.
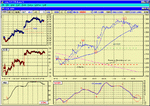
The Advance /Decline line may well give us the answer on Monday.
Any comments ?or other views ?
Attachments
The Life of Brian cont'd .............
When a market bottoms, you always have the problem of
deciding which stocks to pile into, especially if you need to
replenish your portfolio.
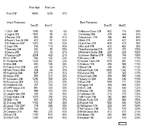
You could keep it simple and choose the most volatile or you could choose those which have performed best during the fall.
Here is a table which shows both categories.
I havent shown the price now as some have come off their tops.
And I haven't shown the highs since the Ftse low.
So I have left something for you to do ,if you want to pursue the 65 day rules.
When you have put the highs into the table and see which group has done best,
you may be surprised at the result ?
I havent mentioned selling signals , well not yet anyway.
Attachments
- Status
- Not open for further replies.
Similar threads
- Replies
- 478
- Views
- 70K
- Replies
- 2
- Views
- 3K


