You are using an out of date browser. It may not display this or other websites correctly.
You should upgrade or use an alternative browser.
You should upgrade or use an alternative browser.
- Status
- Not open for further replies.
Bonsai,
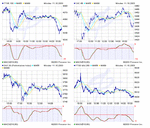
I see you have used Bigcharts. I like them too, however, their default MACD (12,26) I find frustrating. It cannot be altered? Are there any other sites that allows both ! min charts and the ability to manipulate the MACD? (An attempt to resolve the MACD 60/501 problem
I see you have used Bigcharts. I like them too, however, their default MACD (12,26) I find frustrating. It cannot be altered? Are there any other sites that allows both ! min charts and the ability to manipulate the MACD? (An attempt to resolve the MACD 60/501 problem
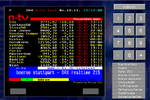
its cheap and nasty but it's fun ?
here is the link
http://www.n-tv.de/2947133.html
pages 204 and 208.
here is the link
http://www.n-tv.de/2947133.html
pages 204 and 208.
Attachments
Out since first post of the day,
Not much point today anyway, sierra/ Mytrack UKX feed down 🙁
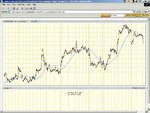
Looking stronger than anticipated- probably be able to make a bob or three on all indicies at all resistance levels DAX 3815, UkX c.4400, S&P 1062 & 9900 on the INDU , imho.
Not much point today anyway, sierra/ Mytrack UKX feed down 🙁
Looking stronger than anticipated- probably be able to make a bob or three on all indicies at all resistance levels DAX 3815, UkX c.4400, S&P 1062 & 9900 on the INDU , imho.
if you cant follow the 1hr/1 day I can see that it could be irritating if I continually refer to it.
but it has just pulled back up to zero.
rsi is now under 30 and a/d although negative is pretty flat.
on elliott since the low this morning, we have had either an abc and are going down
or 1/2/3 and are now in 4th.
candle chart shows an inside day.
so , completely ambiguous again
it wont take much to tip the scales.
Bonsai.
When you hava got a spare minute after trading.
Could you please tell me how to include more than one html chart on same page.During August, you showed-- ftse,cac40,dax30 and ftse mid250 on the same page.I would like to have ftse 1day.5days.10days and 4weeks on same page,if it's possible.
Hope you can regards. Jon
PS Went short at 618 shortly after my post,this is realy realy adventurous for me !!!.
- Status
- Not open for further replies.
Similar threads
- Replies
- 478
- Views
- 70K
- Replies
- 2
- Views
- 3K


