lurker
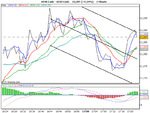
what time frame do you use? i can only see that shorts on an intraday basis were the risky options vs patient longs. a 4 hour chart will show that.
edit: adding a 60 min chart
j
Thanks for the input. I use a 5 minute chart for the YM and tick, with a 1 minute chart for entries. Both charts have a 100 minute EMA.
The charts you posted were very very useful indeed. At first I didn't recognise the market, not ever looking that far back (I take 5 min or days, nothing between). That is a glaring flaw in any method I am using. Ouch.
In retrospect, even on a 15 minute, why didn't I
see? I am far too focussed on the short term, and that is an issue which needs to be address. I don't wish to scale, and a SB spread makes that impossible. I need to look at longer timeframes and look to hold for longer. Even a 15 minute would have shown a failure to make a lower low combined with the higher high quite easily.
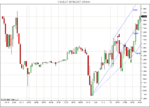
Attached chart where the more sensible entries and exits are. First entry a bit of a gamble on failure to break low. Exit on double top, short on the downward swing. I got the bit about being short here quite correct, though I was forced to cover by TradIndex losing their web platform. Cover short and go long around 4:30 on a failure to make a lower low, and the consolidation you suggest. Longs to be added to when price respects the lower trendline. Uptrend was clear by this point on longer timeframes. On shorter ones, every advance looked like a bear flag. We are in a bull market, and it was obvious to me there would be a bounce last night. And this morning. And I didn't trade it. I said clearly rally towards the close. I was looking for double top reversals where they didn't exist. Shorts had ceased to be a good idea on a 15 min chart (attached) since before 5pm.
Oh dear. Looks like I need to make some effort to consider my timeframes and exactly how to trade this beast. 5 min charts don't seem terribly appropriate - perhaps I should use them for entries instead, and take a 15 for trend? Hmm.
Attached shows retrospective postulations, and an experiment with a
pitchfork.
I hope this helps others - This knowlege is helping me. Saying that, shorts are looking rather good right now if 50 breaks. Otherwise it could give very strong support to the upside.
Not watching this market any more this evening, but I will be working on my strategy I expect. Postulations for the journal will follow.
Thanks again.