BBmac's Gbpusd thread

W/e fri 16/10/09

Pippy500/Gamma etc: Thank you for your comments.
----------------------------------------------------------------------

Cable ended the week just off it's early Friday Hi of 6398, having made a HL off that HH in the 1hr uptrend followed by a LH then another HL. The 1hr screenshot is below and price had continued to find supply in the previous swing hi=prev res=potential res zone @ that LH ahead of the close...the HL's below it however, coupled by Friday's Bullish candle close and the Weekly bullish candle close that engulfed the previous 2 bearish Weekly candles, suggest more upside is probable.
fdrne1.gif

This 1hr screenshot shows the potential support/rbs factors on this t/f above the zone marked as b on the 4hr screenshot below. Upmove fibs are currently drawn on this 1hr chart from 5707-6398 and 5919-6398.

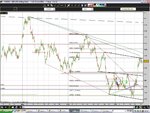
Turning to the 4hr t/f and the move up off 5707 from the previously mentioned 3 fib cluster likely caught the bears off guard (fundamentally speaking the recent across the board $ weakness finally caught up with gbpusd aided by 'less worse than expected' data and Boe suggestions of a halt to the current £175bn Qe programme) The move up from 5707 breeched the 4hr descending resistance trend line and the 50% fib of the main 7044-5707 drop. The uptrend is intact on this t/f too with a HH @ that 6398 Weekly Hi. No fresh sellers either at the underside of the previous ascending support trend line on the Daily t/f (potential sbr @ the underside of H&S neckline on that t/f.) The unbreeched fibs on the 4hr screenshot below relate to the 7044-5707 and 6740-5707 moves. Shown too are the obvious near-term previous swing hi/lo's on this t/f that are potential support/rbs and resistance/sbr zones, particularly if co-existant on other t/f's/with the confluence of other potential supp/res factors like fibs/trend lines.
f1351.gif

The zones shown as c, and d are co-existant with obvious previous swing hi/lo's on the daily t/f, and zones a and b are co-existant on Daily and 1hr t/f currently. A steep ascending potential support trend line is evident from 5707 Lows.

Turning to the Daily t/f and the fib shown is of course the main 7044-5707 move. There is a descending potential resistance trend line that will come through on this t/f, descending from 6440 @ next open. This t/f has seen a H printed above the last LH of it's downtrend suggesting that the downtrend on this t/f may be in some doubt now. Friday's 6398 was in a prev swing hi=prev res=potential res zone on this t/f, and at the top/near top of the descending channel of this t/f, as the 5707 weekly low was at the bottom of the same descending channel.
qp5jxc.gif


G/L for forthcoming week's trading.
 
Mon 19th Oct

Opening gap down today and after an early rally cable continues the selling, reacting to the Earnst & Young Item Club report apparently. The sell-off has resulted in a 5/30min downtrend and the screenshot below shows the 1min hidden-divergence based re-entry (to next t/f trend after a pullback) set-up that resulted in a nice pip gain...the 2nd set-up saw over 20pips gain available but so far has not resulted in a 'with trend' follow thru to a new LL as yet, and I am watchibng the 5min t/f for a potential HL in it's downtrend.

2s6293n.gif

2a4tndd.gif


G/L
 
This is how I am see-ing the 1hr currently in respect of potential supp/res factrs, the chart shows the fibs from 5707 and 5919-6398, as well as the dotted 6398-current intraday low, as well as prev near-term obvious sw hi/lo zone and trend lines (widde dotted = breeched) The dark green horizontal dotted lines are the unbreeched fib fan of the 5707-6398 move.

As always I am looking for hi-probability set-ups/price action triggers at potential supp/res/sbr/rbs, particularly the confluence of set-ups and potential supp/res factors on this and other t/f's.

G/L

xohzfb.gif
 
Re-entry to 30min downtrend??

Pullback in 5/30min downtrend from 6240 extends to 6296, (5min fib channels ascending into price at the bottom,...good confirming indicator...
16ga3k1.gif

5min hidden-divergence based re-entry set-up develops (timed as a 1min Reversal set-up) but @ a HH after 3 x HL on this t/f, although @ still a LH on 30min into whose downtrend the set-up indicates a potential re-entry after the pullback..all in all though not optimum pa conditions for a re-entry for the reasons mentioned..
zn2ebp.gif

Have therefore rejected the set-up @ the potential sbr = prev 1hr swing lo=prev supp=potential sbr..
65pp9s.gif


Right decison,? well, whether price goes down from here or not, on the t/f's I am trading and for the reasons mentioned, yes it was...you can only trade what you see on the t/f's of interest to you....

G/L
 
This is the 1min trigger to the above Rejected 5min Re-entry set-up, an oscillator extreme based Reversal set-up with a whole reversal candle (dark cloud cover) closing outside the 20bol (white)...a case of extreme deviation...shame as decent trigger set-up to the 5min Re-entry to 30min downtrend, and has seen +20 at time of writing.
34hylqw.gif


G/L
 
Had the above set-up devloped at a HH instead of the 2nd HH, I would still have been interested in trading it for small pip gain and see-ing if any downward momentum on 5min candles worth holding. but @ a 2nd HH after 3 x HL, - no...subsequently price has found support at the 50% of the move up off 6240...as seen in 5min pic below...

2j44tur.gif
 
Looks like this channel I predicted might be taking... if it does, next high prob touch/ major support is at the 161(ish) area which would be retest of prev swing, 100%, mid-channel, and s turned r. That top has had far too many hits with proceeded by a succession of lower lows on the turnabouts. IB at 9 oclock hourly shows indecisiveness after Fridays huge move so I'll be looking to get short here if the action shows it.
 

Attachments

  • hmmm.JPG
    hmmm.JPG
    177.3 KB · Views: 128
Price pulls back off the 3rd HH in 5min uptrend to create a 1min hidden-divergence based Re-entry (to next higher t/f-5min uptrend after a pullback) set-up for a quick +10pips booked before the regular divergence based reversal set-up @ the 50% fib of the 6398-6240 , mni earlier touting offers around 6320/25,...no 5min supporting set-up but a 15min hidden divergence based Re-entry set-up (Re-entry 4) to 1hr (? questionable) downtrend,...have just closed this trade from the set-up for a small pip gain for the reasons stated...Am wondering if today's current 6240 Low is the base from which the bulls make a push for a new HH above 6398 in 4hr uptrend?...howevere - will continue though to trade what I see, not what I think !

jhgfpu.gif


G/L
 
HL and a H although that H not above last LH now in 15 and 30min downtrend.
 
Just looked agian @ 1hr and there was a better downtrend than I had seen at first glance re that 1min Reversalset-up with 15min Re-entry (to 1hr downtrend after a pullback) set-up discussed in post #189 above...shame as would have held for more pip gain...15min hidden-divergence based Re-entry set-up is shown below
2hcgbyp.gif

and the 1hr downtrend is here

Set-up came at a H on 15min although still at a LH on 1hr into whose trend the set-up indicated a re-entry opportunity...entry fine-tuned on the 1min
331fup1.gif


G/L for rest of session
 
New HH in the 4hr uptrend yesterday and an even HH today @ 6447...Nice regular divergence/extreme oscillator based reversal set-ups @ 0710am London extending to the 4hr t/f...@ this HH -the potential resistance of the previous daily swing hi=prev res=potential res and the descending potential res t/line on that t/f...price had entered a 4hr prev sw hi=prev res=potential res zone too....a sell-off below the asian/overnight session Lo has resulted off the London open.

G/L

15vrbo.gif
 
It's in the Charts !!

Funny how the technicals always know , this was the 5min t/f ahead of the 0930am London Uk data release after some heavy selling off the London open,...a bullish divergence based reversal set-up...and price duly bounced up on the release of the data..There was a regular sequential bullish divergence set-up on the lower 1min t/f also.

G/L

e0hpnq.gif
 
what oscilators you using? none of mine picked that up (was long anyway tho :D)

In descending order.... osma/macd/cci wrapped around a 20bol. Mni had touted bids @ 6360/50 beforehand and the 100day sma was also there.

[For the avoidance of doubt the macd shown is actually a histogram of the signal line not the 'standard' macd histogram of the difference between the signal line it's ma line, which is effectively the osma.]

G/L
 
Further cable upside progress struggling (at time of writing) at the base of that 1hr/4hr prev swing Hi=prev res=potential res zone, co-existant with 76.4% fib 6446-6352 (cuurent intraday Hi-lo) aftre the early see-off from 6446 and recovery @ 6352..1hr chart below shows the potential supp/res/sbr/rbs factors as I see them and the yellow horizontal line is the 100sma on this t/f, speaking of which, the current lows @ 6352 were right on the 100day sma. Fibs shown are 5707,5919 and 6240 to 6446.

U.s data due later,

G/L

1zoxpph.gif
 
Weds 21st Oct-early london session

The 5min chart below shows how quickly a trend can change from the uptrend to a downtrend...and see how price found resistance @ the previous swing lo's marked by the green lines, [previous swing lo=previous support=potential sbr.]
24qveat.gif

@ the 2nd LH a hidden-divergence based Re-entry (to next t/f trend after a pullback) set-up developed on the lower 1min t/f see-ing +30+ pips available;
t0svmh.gif
 
Non-optimum Re-entry

I did trade the following set-up as price approached the prev 1hr swing hi=prev res=potential rbs zone:
2s8k8p4.gif

A 5min hidden-divergence based Re-entry (to next higher t/f trend after a pullback) set-up developed, but as shown on post above @ a LL although still at a Hl on 30min into whose uptrend the buy the dip entry was indicated:
142x37k.gif


Entry was timed on 1min as a regular bullish divergence based set-up:
2vboah0.gif


I have booked profit as the LL on the 5min (ie on the t/f the re-entry set-up developed on, was not optimum coming at a LL not an immediate HL like the 30min.) Will it see a 'with trend' follow thru above current 6436 intraday Hi,? ...no idea, but you can only trade what uyou see within own rules/guidelines. Had 5min price action been compelling I would have held for more upside pips.

G/L
 
2nd bite of the ' long ' cherry

So that long described in post above pulled back from the first HH (that printed below last LH of prev downtrend) to a HL at the potential rbs of the previous 5min swing hi (non-fractal prev swing hi...so slightly imperfect) but the market entry with the 1min hidden-divergence based Re-entry set-upo, also shown below saw 5/30/1hr/4hr macd signal lines all pointing north...
etwi9e.gif

The 1min Re-entry (to next higher t/f trend after a pullback) set-up is here:
23wjjw8.gif


G/L
 
Top