Re-entering a trend

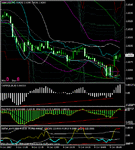
The screenshot attached shows the 5min chart set-up at that support mentioned above. Notice the bulliosh divergence in the oscillators along with the bullish candle pattern circled in red. The 5min Reversal set-up is what I call a ' Reversal type A(ii) seq ' seq refering to the pattern of regular serquential divergence in the lead oscillator (osma) macd being regular immediate. There was a nice Reversal set-up too on 15min chart too.

0269-0296 remains the last 5min SBR zone. Mni talking about offers now at 0300 (minor) and stronger at 0320/25.
 

Attachments

  • 5min.gif
    5min.gif
    19.3 KB · Views: 230
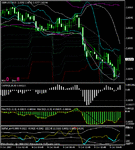
the screenshot shows the 15min confirming set-up for that Reversal off support discussed above. It is what i call a ' Reversal type B' and again note the bullish divergence in the oscillators at Support.
 

Attachments

  • 15min.gif
    15min.gif
    17.4 KB · Views: 179
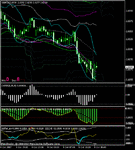
The screenshot attached shows the 30min set-up at the support discussed above. This is what i call a ' Reversal Extreme (ii). The corollary effect of having confirming set-ups on the intermediate/[next time frame if applicable, for me...15min] and longer time frame is that it presents a stronger market entry signal as well as highlighting the potential for a larger target than if the signal just existed on the trigger chart. Indeed 'against trend' set-ups that only exist on the trigger chart without any other charts confirming set-ups (at least on intermediate) are treated with caution and have small 'scalp targets' only.

These set-ups are fully described in the documents attached to this thread:
http://www.trade2win.com/boards/showthread.php?t=25770


but I must make the point that any indicator set-up/pattern without known identifiable support/resistance potential are just pretty patterns (lol)
 

Attachments

  • 30min.gif
    30min.gif
    15.9 KB · Views: 216
Strong recovery off the lows at 0256 level, probably helped by the UK PBR statement the Chancellor. Medium offers reside at 0350/60 ahead of the asian hi at 0373, 0370-80 area and of course 0400/10, 0445/55 and 0490/00 the main potential Resistance areas to look for in any extended recovery.

104 the days hi-lo pip range so far, above yesterday's 95 but still below the 5,10 and 20 day averages.

Enough from me today.
 
Last edited:
I'm discontinuing my regular contributions to this thread now, but will answer any questions that may be posed. Hope it's outlined some technical tricks in trend following etc. Good luck to all
 
I've summarised all the essential knowledge in this thread into a Bullet point summary (attached.)

Good example today in gbpusd's price action of point 3 and point b in the document summary, ie price finding support in the 0391-0361 RBS zone at the 50% fib retrace of the intraday move up, the intermediate (5min) RBS zone being a clear 15 optional 'next' time frame, and 30min 'longer' time frame RBS zone too.

Hope this helps.
 

Attachments

  • SBR RBS trend methodology.rtf
    3.6 KB · Views: 280
Top