Re-entering a trend

UBS's current take on it

You'd have thought UBS's mind would be on other things today (lol) this is their current take on Gbpusd:

'....GBPUSD's break of Sep 12's 2.0366 high maintains the up-trend pattern of higher highs and higher lows originating from Aug 17's 1.9653 reaction low, thereby keeping our focus on the 2.0654 trend high from Jul 24. (Diagram 3). Support cuts in at the formerly resistant 2.0321 level ahead of 2.0086. This is the minimum level that would need to break to threaten the immediate bullish GBP tone, with a loss of 1.9880 necessary to undermine it. Over the longer-term, while it's unlikely to be a one way street, a break of 2.0654 should unlock 2.1218, the 76.4% retracement of the 2.4540 to 1.0463 (1980 to 1985), decline. ....'
 
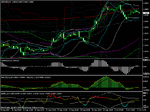
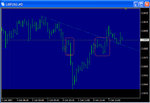
Point A - B is the SBR zone and point C is where price is re-testing the area following the depper pullback.

Hi bb,
a question, if I may

How, or what candle patterns, did you use to decide A-B on the 15 min was a SBR zone? I ask because after this had formed, I discounted it as SBR, on the grounds that the remaining 2 bars in the formation were inside bars. So, internal to the formation, there was no break of the high of the first bar at any point. What is it in this set of bars that you use to perceive SBR? Is it enough to see a range there? or is it because when viewing the smaller time frames, you can see the price action making the double top, which you carry over to the 15 min time frame?
 
reply

Hi Fish

I don't really look at the individual candle action , just that the candles have resulted in a lower low and a lower high in this downtrend example to form an SBR zone. Continuing with this down trend move I do however like to see a retrace that contains actual bullish candles in an sbr zone on any time frame, rather than a retrace in the same candle for eg. In this 15min example the lower swing hi area at 0453 area was tested twice, and it was also a minor higher swing low that formed the base of the last leg up in the late asian/ovenight - early London sessions, (see point X on attached screenshot.) Of course the zone was also a 5min SBR zone too.
 

Attachments

  • 15min.gif
    15min.gif
    12.8 KB · Views: 183
Thanks for the reply bb, I am beginning to see how you approach this. This way of describing price flow is making a lot more sense to me now.

Looking back on the day, the 08:15 BST high at 2.0492 is a classic reversal point, (although to me only in hindsight 🙂). Price moves out of the Asian range on Monday morning, tests the closing high on Friday, and reverses. I can imagine an experienced trader would "see" this, and take the short trade. However, if I am following the system, I will not have a trade until I see a LH and LL on the 30 min time frame to confirm the change of trend, which does not occur until 80% of the way through the down move. I suspect that, to an experienced trader, the system provides a descriptive structure of market movement, chopping the flow up into meaningful patterns which then have relationships to each other - and that you yourself might well take a reversal trade at the top of the range, although maybe not with full size.

Can I ask, when you trade, do you follow the "rules" of the system, without fail, ( i.e., only in the direction of the trend when 30 min and 5 min are in agreement) or do you use it to provide the context within which you make subjective judgements about where to place a trade (either with or against the trend)?
 
reply

In respect of the specific example of today's price action, the reversal from the 0492 highs this morning around the friday highs, saw price some overbought readings/divergence in othe oscillators up to 1hr chart. As the screencaps of my 30min and 1hr main charts also show price had veered outsidew of the fib tunnels on those time frames again indicating overbought conditions. MNi had also been suggesting that a large option barrier existed at the 0500 level with likley protective sales in that region. This, the area of Friday's high (27/7hi also) provided the resistance.

Generally, my own trading encompasses both with and against trend technical set-ups that centre around oscillator extremes/divergence with band/channel deviation at clearly identifiable areas of support/resistance/sr/rbs, and I make objective decisons based upon a set-up presenting itself at these areas. Because I trade multiiple set-ups on one pairing as opposed to one set-up on multiple pairings, I am able to get 'in-tune' with the particular character of that pairing, and can produce a detailed and continually updated assessment of where support/resistance/sbr/rbs may lie. It is then a case of awaiting price to reach such an area and judging whether the technical conditions/set up suggest a favourable outcome is more likely than not.

As for re-entering a trend before the longer time frame (30min) is trending, I will re-enter if there is evidence to suggest that the trend is more likley to continue/develop than not, resulting on the 30min (+) breaking out of a range/exceeding a swing point to trend itself. These factors include strong reversal set-ups/technical conditions on the longer time frames/good thrust candles on the 15min+ etc....

The rules of my system/methodology are 2 fold, being a. The set-up rules (ie the technical indicator pattern/conditions) and b. The 'application rules' that aim to limit the execution of a trade when a technical set-up presents itself to the highest probability wider technical conditions. These rules allow for such conditions regarding re-entering a trend that currently only exists on your intermediate time frame, but generally speaking where the highest probability conditions don't exist i will use less risk.

Hope this answers your questions.
 

Attachments

  • 30min.gif
    30min.gif
    28.6 KB · Views: 204
  • 1hr.gif
    1hr.gif
    22.7 KB · Views: 188
Last edited:
Tuesday

Tuesday's asian/overnight range was a tight 0438 - 0406, and the london session has seen quite a tight 76pip Hi - lo range. The Support at today's lows coincides with a 23.6% fib of the rise up from 9951 to the 0492 highs, as well as a former major 4hr swing hi from 12/9.
 
Tuesday cont....

End of the London/European session sees the Gbpusd 78pip Daily Lo-hi range hold, (0367-0445.) A further dip in the U.s pending home sales # (-6.5%m/m, -21.5% y/y,) saw an initial knee jerk reaction high to notional new highs before a quick reversal from them back into the range. Today's range so far falls below both yesterday's 116pips and well below the 5 - 20 day averages that fall between 153 and 172pips.

Potential Resistance to the upside remains at that 0450-55 area a break exposing stops above to target the 0490/00 Friday /Monday high area/reported option barrier area. Dly R1 resides at the 0487-92 area too.
 
weds

Weds asian/overnight 0422-0389 asian session range breaks to the downside, rtercaing back into the range from a marginal 0387 low, before another leg down to 0375 retracing to 0395, so that becomes the nes potential SBR zone.

Support at the current days lows is around the 50% of the move up from 0194 and the 38.2% of the move up from 0085 to Monday's Hi at 0492 area.
 
the 15/30min potential SBR zone is 0387-0422, but it comes after only a marginal break of the asian/overnight session range, and rangy conditions behind it.

Price is currently at the top of the last 5min SBR zone mentioned in post above, with MNi now suggesting that offers reside on the approach to 0400 now with minor offers at 0420 and more at the days highs through 0450/55 agead of that 0490/00 level.
 
Price breaks up above the last 5min SBR zone now after finding some minor resistance ahead of those offers at 0390/00 area, it is now in the last 15/30min SBR zone after a strong recovery off those lows. If it breaks above here I won't be looking for shorts ahead of the next real resistance.
 
Sure enough as the last 0375-0395 5min (intermediate) potential SBR zone is broken to the upside the next time frame up's and the longer time frame's 15/30min last SBR zone contains price now selling off those 07 highs to 0395ask as I type this (0387-0422)...[see cautionary note above.]

That retrace from 0395-0378 on the way up from the lows doesn't strictly make an RBS zone as the last 5min swing high on the way down wasn't exceeded by that swing high on the way up, (marginally) but I wouldn't be surprised if it didn't find support there off this retrace if the recovery continues.
 
That retrace from 0395-0378 on the way up from the lows doesn't strictly make an RBS zone as the last 5min swing high on the way down wasn't exceeded by that swing high on the way up, (marginally) but I wouldn't be surprised if it didn't find support there off this retrace if the recovery continues.

Might just be a platform thing. I just want to check that I have got the hang of this, and that I'm looking at the same thing you are. Is this what you are referring to?
 

Attachments

  • 0710031204 5 min sbr.png
    0710031204 5 min sbr.png
    13.8 KB · Views: 160
Hi Fish, that's it yeh, probably just a platform thing as you say.


Mni latest saying bids now at 0380 stronger into 0350/40 with offers 0410/20, stronger into 0440/50.
 
Price finds support in tht marginal RBS zone referred to above in the 5min uptrend, now finding resistance in the 15min SBR of the downtrend, at the 50% fib of the move down from Monday's hi to Today's lo @ 0416 area.

All this action occurs inside the intraday hi-lo so any 5min uptrend from the lows rbs zone and indeed any 15min SBr zone (as the intermediate last sbr zone was exceeded) so caution should be excercised. 5min has now made 2 higher lows and higher highs though below the last swing hio of the last 15/30min SBR zone.
 
Price makes an equal high again at that 0416 area (still in the last SBR zone of the 15/30min downtrend 0387-0422) but 5min has seen now 3higher lows and 2 higher highs , 1 equal high since the recovery off the lows....this price action occuring below the daily high.

0378-0416 looks like a 5min consolidation/intraday congestion zone now, so probably need this to break before the intraday picture becomes clearer again.
 
U.s data up at 3pm london , the ISM services. The headline forecasts looks mildly $ negative but particular interest will be the prices paid and the emmployment components. Will prices paid confirm the pce 3.5yr low ? and with ADP suggesting +58k for Sept payrolls, is the service sector employment contracting? 3pm will answer these questions.
 
The attached screenshot shows where the majority of this week's price action has occured and although the Hi and lo of the week so far fall out of this zone, price currently remains in it (as i type this) so a decisive break of it either way is required to get us out of the 'congestion.'
 

Attachments

  • 1hr.gif
    1hr.gif
    13.5 KB · Views: 164
Support to the downside now area of mon and Tues lows at 0376/0368 which is also the area of 50% of move up from 0194 and 38.2% of move up from 0085. Below this and the fibs at this mornings lows come into play again, area of 0340/50. This area also houses the Weekly pivot.

Below here and 0320/25 being a previous 4hr swing is an area that MNi suggest houses some minor bids, (0328 Dly S2 pivot) but the area 0300/0310 stronger bids likley with the 61.8% of the move up from 0194 at 0308 and 3 more fibs residing between 0287--0289. (0289 Dly S3 pivot) 0312 was last weeks B/o level .

Todays hi-lo range is 102 so far higher than the 78 y/days but still below the 5/10/20day averages. Potential resistance is noted in a post above.
 
Just to add some clarity

1. When an intermediate sbr/rbs zone fails to see a continuation in the trend and it's highest/lowest point is exceeded, look to your next time frames last sbr/rbs zone to provide res/supp for a continuation in trend. Today is a good examle of that, whereas the last downtrend 5min intermediate sbr zone at 0375-0395 was exceeded, price then found resistance in the 15/30min last sbr zone at 0387-0422.

2. Always looks for previous swings/potentially importnat points in those sbr/rbs zones to time entry on your trigger like that 50% fib of 0492-0339 today at 0416 in that alst 15/30min sbr zone.

3. A retrace that exceeds the last intermediate sbr/rbs and finds supp/res in the next t/f sbr/rbs zone like today will might well have sbr/rbs zoneso n the intermediate chart in the opposing direction to the original trend. Today is a good example of that on 5min as the intermediate. I mostly always give preference to the next t/f's sbr/rbs zone of the original trend if i want to hold a trade, as inevitably the new opposing trend intermediate sbr/rbs zones will like today fall into the intraday hi-lo range if still below the last sbr/rbs zone of the original trend on the next time frame up, like todays 15/30min 0387-0422. This of course is dependent on/subject to any fundamental data releases etc.

4. Remember that in re-entering a trade using this methodology always to have your stop outside the other extreme of the sbr/rbs zone.

5. Other ways to get in on a trend:

a. Supp/Res area break
b. Trend line break
c. Range break
d. Buy/sell the close of a thrust candle.
e. Cause it looks like it's going up or down (lol) some do though!

Of all of these I favour d, as another higher probability method, on 15min+. A thrust candle occurs where the body of the candle is at least 75-80% of the total size of the candle including wicks and implies momentum. Of course thrust engulfing are even stronger in the right overall technical set-ups.
 
ism

'.....Service sector ISM for the month of September dropped from 55.8 to 54.8. This is only slightly stronger than the market's 54.6 forecast but the details paint a far more optimistic picture. Price paid, which is an inflationary measure jumped from 58.6 to 66.1 while the employment component increased from 47.9 to 52.7. In contrast to the prior month where jobs were lost, this indicates that job in the service sector actually increased last month. There is no doubt that US economic activity is slowing, but today's report suggest that things may not be as bad as the market may be expecting. Friday non-farm payrolls could actually be fairly firm given the rise in the employment component of the ISM survey, the increased in ADP private payrolls and the larger than expected drop in layoffs. This number is helping the US dollar rally because it provides support for those looking for 100k job growth.'

DailyFX
 
Back
Top