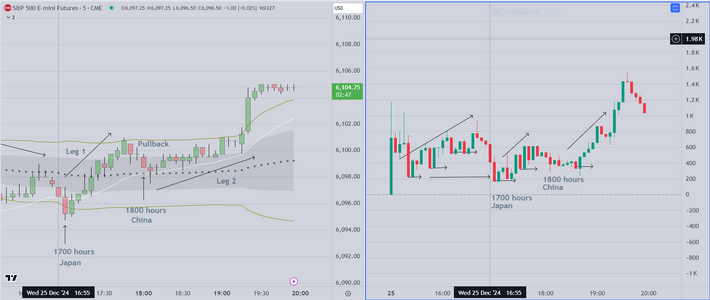
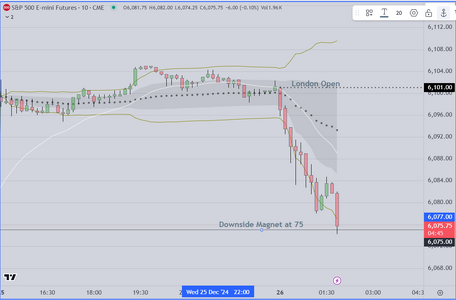
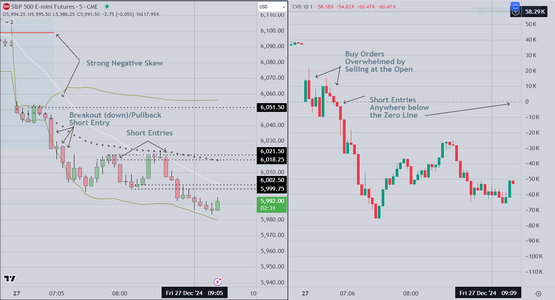
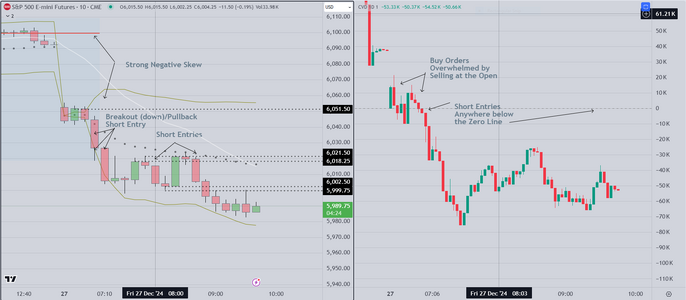
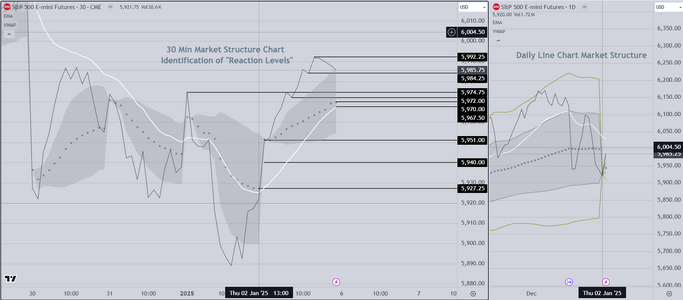
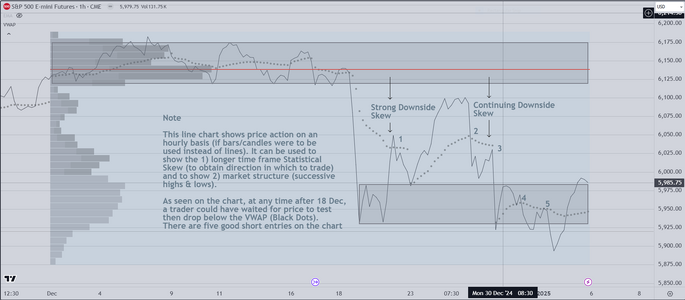
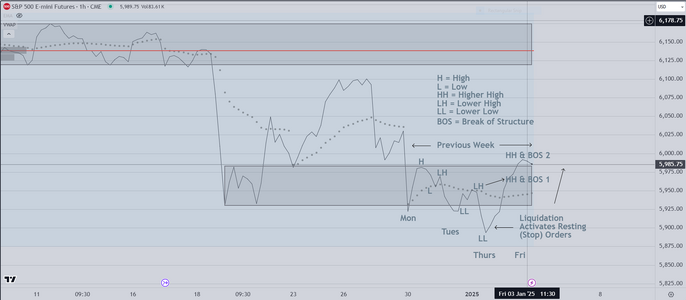
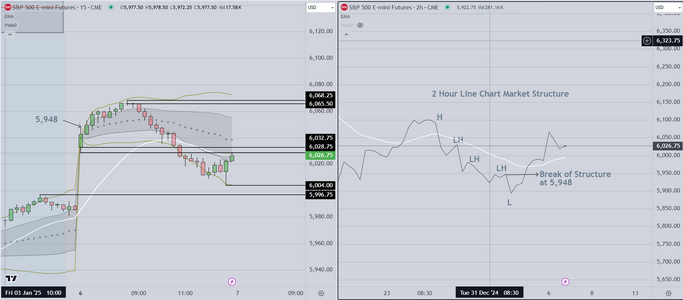
And here is the follow up to the previous post
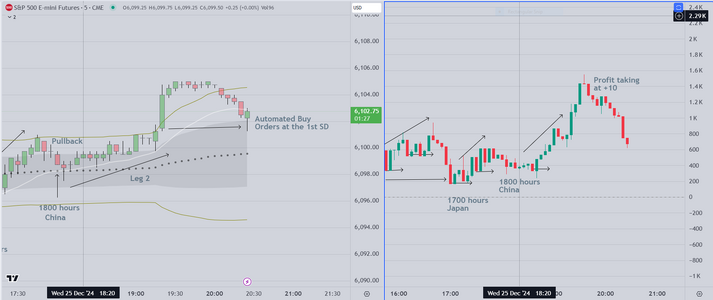
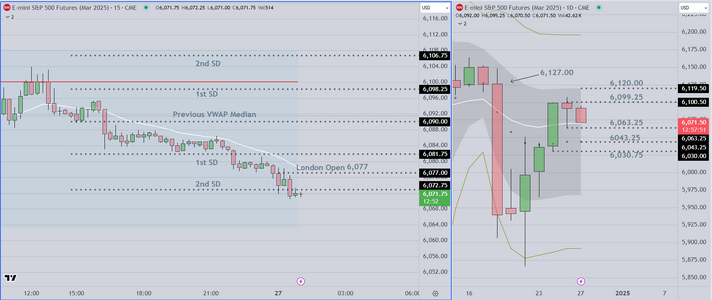
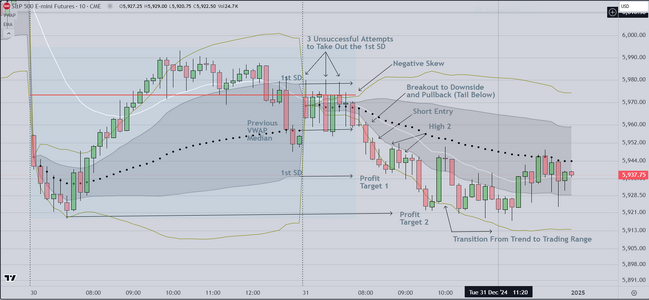
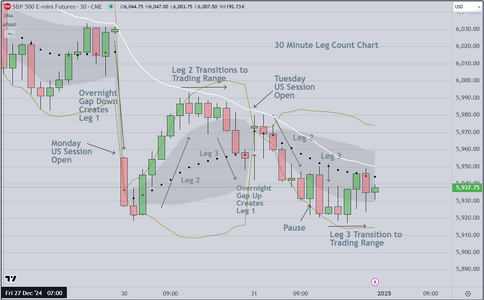
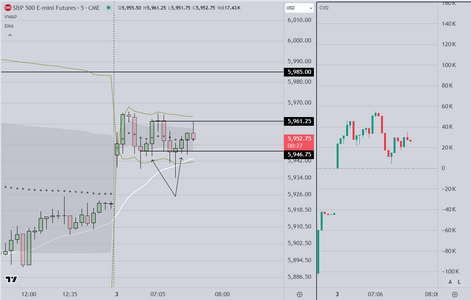
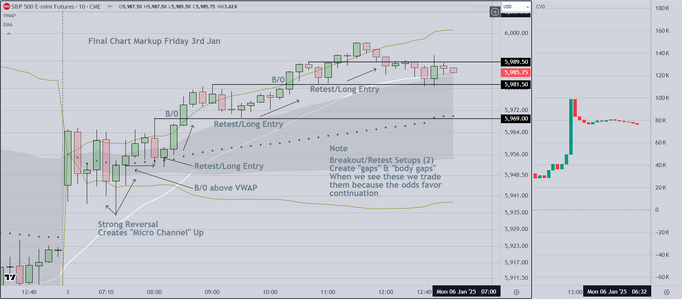
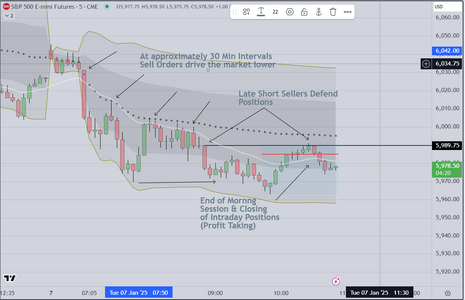
Looking at the right side, you can see profit taking
signaling the end of trade (for the moment at least)
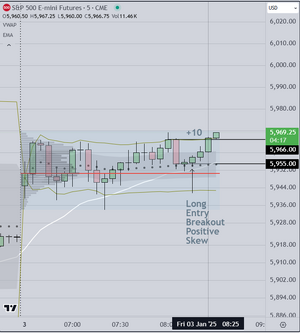
Most of this is automated, in that institutional programs
are activated at +10 pts, or what is (for this time period)
defined as a "measured move".
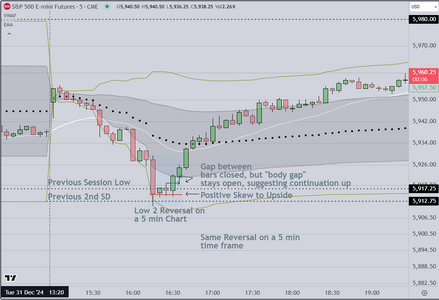
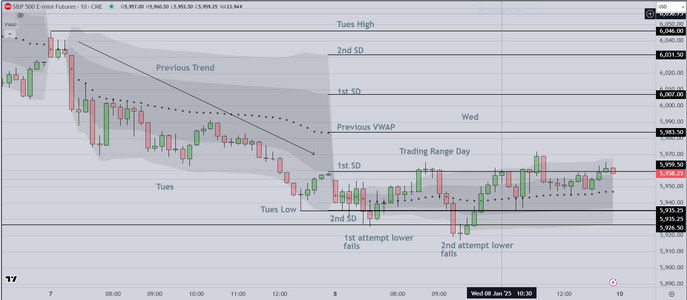
On the right side, this chart shows the profit taking, followed
the programmed buy orders that occur at the 1st SD band
This isn't coincidence. The programs run independently
and are meant to contain (or to try to contain) price within
the envelope until the open of the next US session.
Attachments
Last edited:

