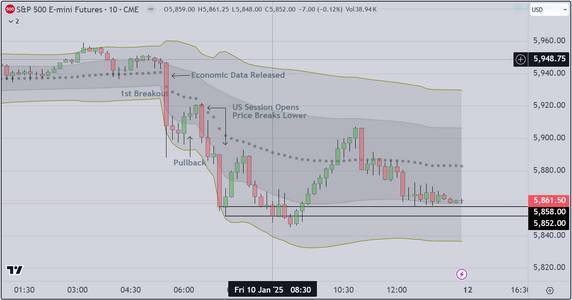
Today is Jan 10, 2025
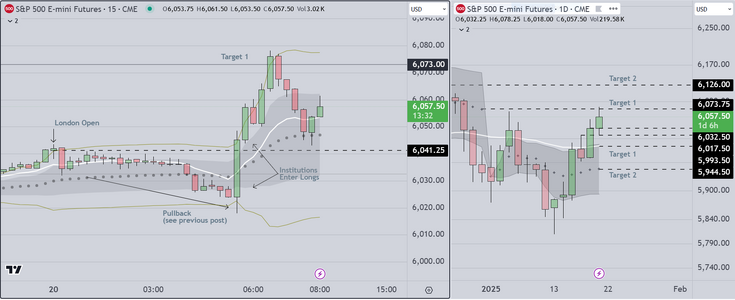
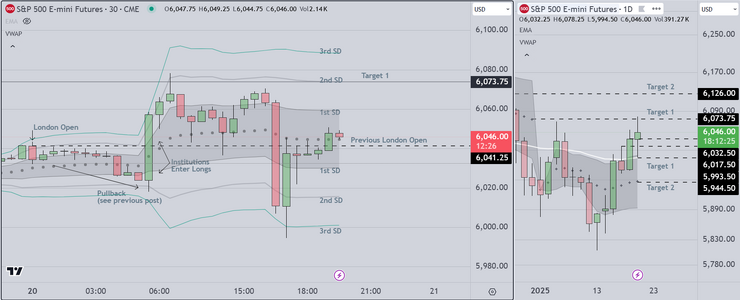
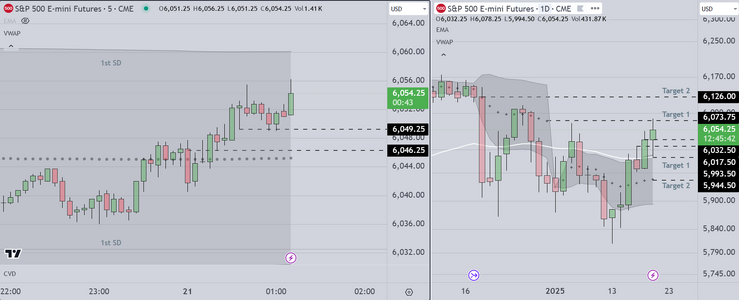
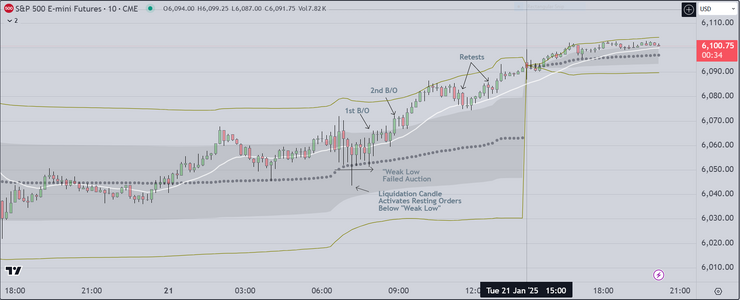
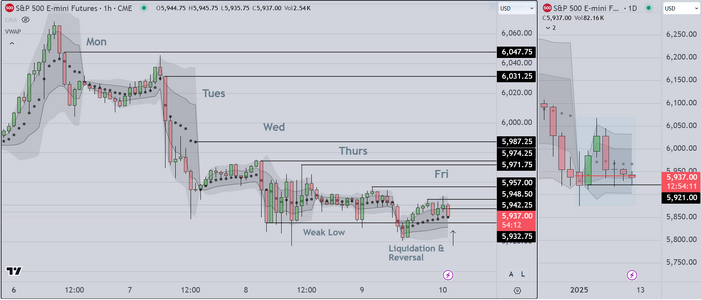
We post our standard Markup showing the larger context (daily candles)
on the right side, and hourly candles on the left side.
For the daily chart, we see what looks like a potential reversal, based on
the liquidation (activation of resting orders below the previous "weak low")
We also note that the skew (red line) is in close proximity to the VWAP (Black
Dots), and that signifies a symmetrical market, meaning that the odds of a
move up or down are about 50/50 (currently). In our experience what this
means is that the market is waiting for economic news (Ave Hourly Earnings
and Unemployment). In addition, this morning the American People will get
to see the person they elected to be President, sentenced as a convicted felon.
A remarkable display of cultural decline.
Going forward it is our job to create scenarios so that we can trade this next
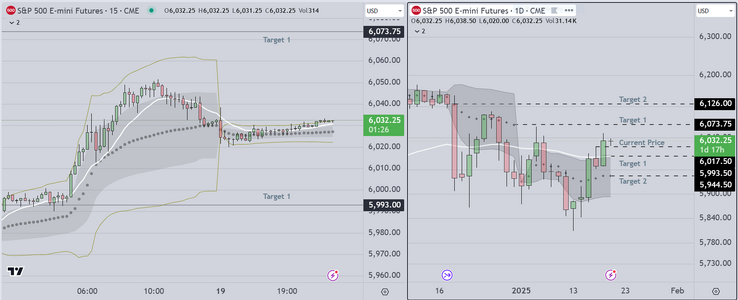
US Session. As usual, we have already reviewed previous historical charts
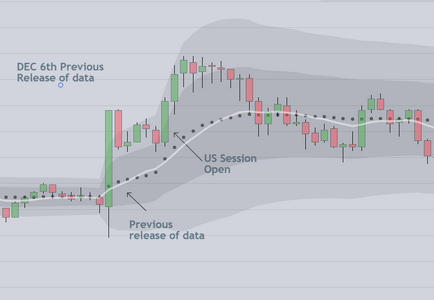
(Dec 6th for Ave Hourly Earnings, Non-Farm payrolls & Unemployment Rate)
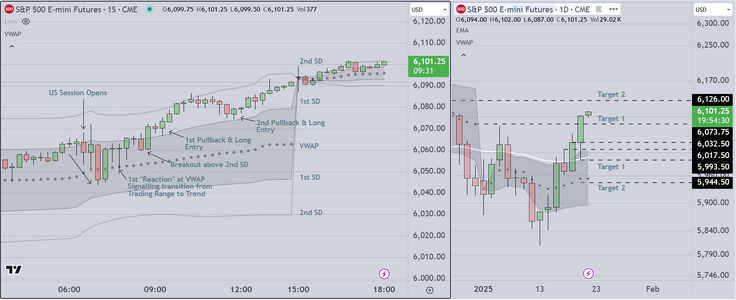
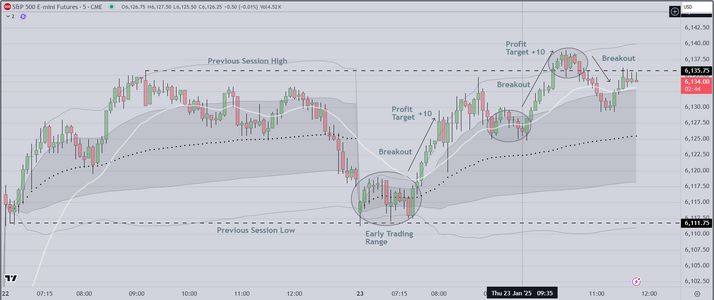
We attach that chart below so that readers can see how that played out. Notice
that the initial reaction was significant, then at the open, the Market created a
strong green candle. Professionals view that "risk event" as an opportunity for
a scalp, and were able to obtain +5 and +10 if they stayed in the trade. We are
NOT suggesting that this session will be the same, only that there is a tendency
for repetition IF the data is similar.
Good luck
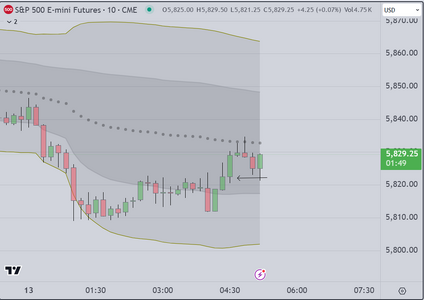
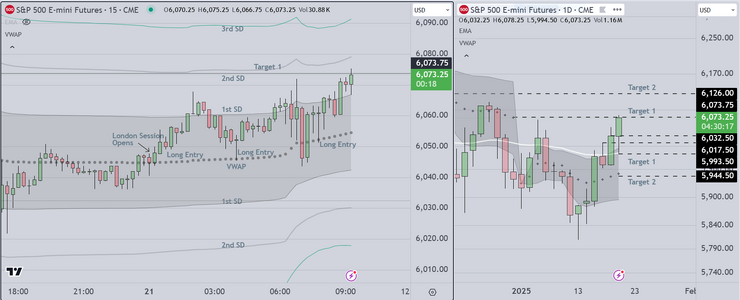
We post our standard Markup showing the larger context (daily candles)
on the right side, and hourly candles on the left side.
For the daily chart, we see what looks like a potential reversal, based on
the liquidation (activation of resting orders below the previous "weak low")
We also note that the skew (red line) is in close proximity to the VWAP (Black
Dots), and that signifies a symmetrical market, meaning that the odds of a
move up or down are about 50/50 (currently). In our experience what this
means is that the market is waiting for economic news (Ave Hourly Earnings
and Unemployment). In addition, this morning the American People will get
to see the person they elected to be President, sentenced as a convicted felon.
A remarkable display of cultural decline.
Going forward it is our job to create scenarios so that we can trade this next
US Session. As usual, we have already reviewed previous historical charts
(Dec 6th for Ave Hourly Earnings, Non-Farm payrolls & Unemployment Rate)
We attach that chart below so that readers can see how that played out. Notice
that the initial reaction was significant, then at the open, the Market created a
strong green candle. Professionals view that "risk event" as an opportunity for
a scalp, and were able to obtain +5 and +10 if they stayed in the trade. We are
NOT suggesting that this session will be the same, only that there is a tendency
for repetition IF the data is similar.
Good luck
Attachments

Last edited: