A Professional Approach to Trading Futures

And the same chart with 10 min candles
From our point of view, it may be easier in
for some persons to read 10 min candles

Personally we have no preference. Either 5 min
or 10 min are fine and in some circumstances
we have even used 15 min candles.

Good Luck
 

Attachments

  • 10 Min Chart Example.PNG
    10 Min Chart Example.PNG
    110.7 KB · Views: 28
This is my Markup for today (Friday 24 Jan)

Although I may continue to post periodically I have been impacted by
the fires that occurred in CA, and am now in the process of building a
new home. My posts will be infrequent.

General Comment

Based on observation I can say with confidence that there are several
patterns that occur frequently enough, to merit considering if a retail
trader wants to construct a viable trading business. They are as follows.

1) Breakout, pullback, continuation
2) Reversal after two (2) attempts in a direction (also known as H2/L2)
3) Head & Shoulders (also known as MTR "Major Trend Reversal")

I see one or more of these patterns every session. They work often enough (for me)
that I have created a viable business based on a) systematic analysis of the previous
week (I call that "What Worked") and b) construction of trading plan(s) for each coming
session that outline what I will do, if the market displays specific behaviors that I call "tells"
because they seem to accurately forecast price moving higher or lower. I have referred to
some of these "tells" in previous posts.

The attached chart is my "after action" report to myself. It shows price action and Identification
of patterns. In the same way that professional athletes practice their skill, I do the same. On a
weekend day (usually Sunday) I go back through the previous week's charts, identifying these patterns,
integrating the impact of economic news, and "grading" my performance.

Good luck
 

Attachments

  • Friday Jan 24 Markup.PNG
    Friday Jan 24 Markup.PNG
    138.1 KB · Views: 16
Good Morning US Traders/Good Afternoon UK

Today is known by commercial traders as "rebound day"
Top Tier Institutions decided that this would be an opportunity
to buy at a discount, mark the market up and then (presumably)
sell the premium later this month.

As regards use of the basic tools, it was an easy day to trade IF
you took the setups, and held. The basic premise we offer struggling
traders is as follows

1) Find an edge. We have talked about this in detail in previous posts
We use pre-market analysis of the market heavily influenced by response
to economic news, and we bring extensive experience to this subject as well.
Based on this analysis we create multiple tentative scenarios

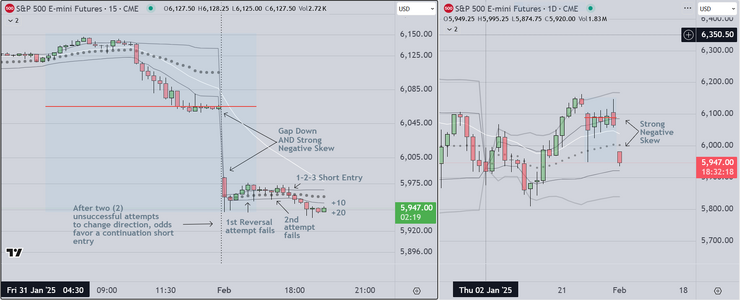
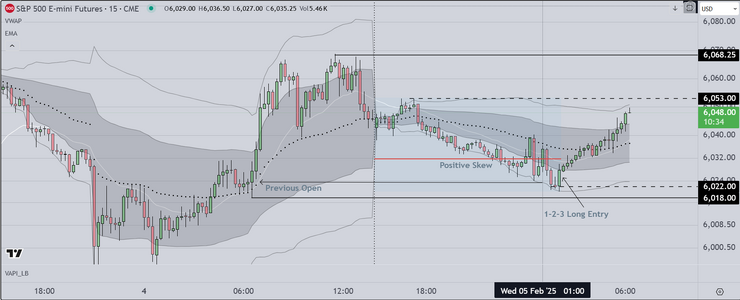
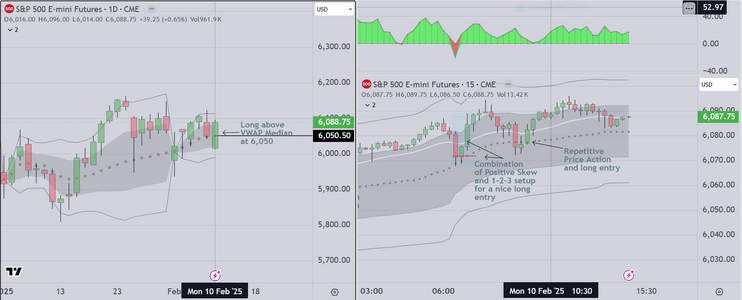
2) At the open we look for "tells". This term is common to persons who play
the card game poker. In a nutshell, we look for a confluence of several signals
including skew, position of price relative to the VWAP envelope, and the initial
response to economic news (when it occurs). We assume that the initial response
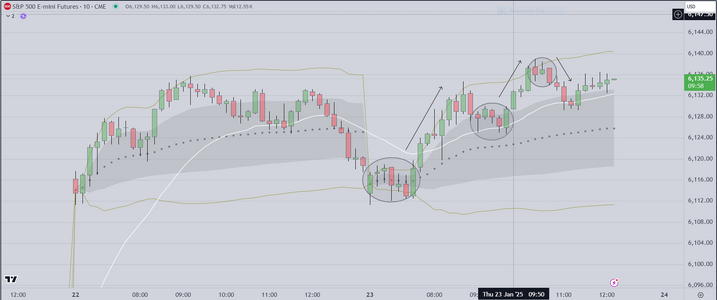
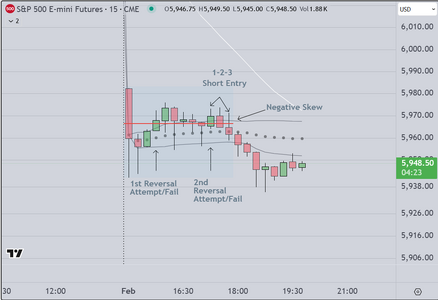
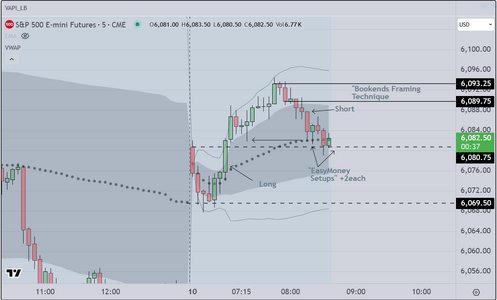
will repeat later during the session (for example, on today's chart we see price
move higher at the VWAP (1st trade) and retest the VWAP later (3 times before
resuming higher).

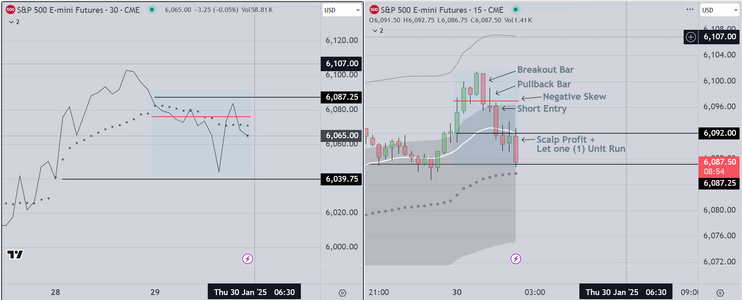
3) When these planets align, we look for one of the preferred setups (previous posts)
we take a small position, and add on pullbacks, or retests of the point of entry.
On the rare occasions when we train retail traders, we suggest trading sim or
if they wish to risk capital, to trade the Micro contract. The basic approach is
taken from game theory and we model it for them by trading two (2) contracts
initially, relying on our stop. At +3 to + 5 pts, we take profit on one (1) contract
This is called "buying a stop", because it provides the trader with an emotional cushion
as they watch the trade play out. If the trade continues positive, they can simply hold.
If the market retests the entry (as it often does), they have two choices. They can exit
the balance for a profit, or they can add, risking up to breakeven. If the market continues
positive, they can choose when to exit, however we always suggest +10 min on the balance.

We are done for the day
 

Attachments

  • Rebound Day Example.PNG
    Rebound Day Example.PNG
    66.7 KB · Views: 13
Last edited:
Hello Traders

Busy morning

Because of pending news, I was up early
taking advantage of the anticipated pre
market move. The strategy is simple

1) Frame the market (mark successive high/low closes)
2) Wait for the breakout (either direction)
3) Enter on the first pullback

Profit target was +10 as always
S/L is -3 from point of entry
We usually leave one (1) unit in place in case the market
runs out to +20

For the US session, we anticipate a trading range day until
the news is released. We have other obligations today so
we won't be trading the next session, which begins in about
an hour.

Postscript

Thanks trader333 for your kind comment. As you and others can
see by now, we plan for this event, by reviewing previous charts.
We use the previous price action as a template of sorts. We also
try to stay out of situations where we anticipate extended trading
range (like today). As with all things, we are sometimes right, sometimes
wrong. In this instance we incorporate our experience and we do
the best we can. Today it worked out well.

Good luck
 

Attachments

  • Trading London Example 2.PNG
    Trading London Example 2.PNG
    100.3 KB · Views: 10
Last edited:
Good Day Traders

Here in the US (West Coast California) it is 2:20am
I could not sleep and thought it might be fun to trade
the London Session

We took a small position, thinking that we would pick up
a scalp profit of +5, then as luck would have it, the market
dropped. We took this windfall profit a few minutes ago
and will sit back and monitor until the US open in a couple
of hours.

The basis of our trades is always the same. This is the day after
an important economic policy decision by the US Federal Reserve
They elected to keep interest rates within the previous range. At
the London Open, institutions tried to rally and failed. Its that simple.
The line chart on the left shows the failure, and seeing this, we waited
for a simple breakout to the downside

Notice the breakout bar, the classic pullback (tail on the next bar)
followed the the entry bar. Notice the negative skew (red line)
confirming the trade. For years now we have suggested that struggling
traders adopt a specific policy as follows

1) Trade small, take partial profit early (pros call this "buying a stop")

2) Hold one (1) unit in case the market runs in your favor (identify your
likely profit targets)

3) Manage your emotions by keeping busy with "housekeeping" chores
such as monitoring market structure, identifying targets, monitor news
etc.

This is as simple as we can make it. Learn to use the basic tools (framing
the market, identifying market structure, preparing by analysis of previous
charts, and dispassionate observation of what the market is telling you).
When entering, choose your stop and hold to it. When wrong get out
promptly.

Postscript

For those who are actually paying attention to this thread we have a last comment
regarding the "tools of our trade". As you review the chart, notice if you will that
price dropped down to test the VWAP median TO THE TICK. The reason for this
is (as we have said previously) that institutional programs control (and react to)
price movement. We teach folks to operate within this framework, and it opens
up the possibility of creating a viable, sustainable business. While there certainly is
an element of random chance, we would suggest, that much of what you see on
a daily basis is pre-determined.

Good luck
 

Attachments

  • London Session Example 1-20-2025.PNG
    London Session Example 1-20-2025.PNG
    113.6 KB · Views: 9
Last edited:
Here is an interesting followup

As seen this is what traders call a possible "roundtrip
reversal

It is also known as a "liquidation", in that it can lure
traders into taking a countertrend trade that results in
a loss

If you follow along, you will see that it did in fact result
in a loss to those who took the entry, The general rule of
thumb is do not take countertrend trades. The odds are
against you

To be clear, "Best Practice" (for skilled traders) is to 1) wait
for a "BOS" (break of structure) using the line chart on the
left, then 2) for the skew to change from negative to positive,
and finally, to 3) take a continuation trade based on a breakout
back to the upside. Simple really, just takes patience.
 

Attachments

  • Follow up to prevous.PNG
    Follow up to prevous.PNG
    119.4 KB · Views: 11
Last edited:
and finally, here is how that pattern played out

The possible "Round Trip" was actually a "Liquidation"
meaning that the market trapped traders looking for
a reversal (countertrend). As mentioned, the odds
are against you when you trade counter to the trend.

Traders who "took the bait" entered long above the EMA
only to have the market reverse on them, and resume
a significant move lower. This is a good pattern for traders
to memorize, because they will see it often.

Ironically I was typing rather than monitoring price action
and so I missed this short entry. As the liquidation progressed
price broke to the downside below the 20ema, then retraced
to test the 20ema, before continuing lower. Short entry was
Just below 89. Profitable trade for those paying attention.
Sadly I do not have the bandwidth to both post and trade.

This will be my last post for a while.
 

Attachments

  • Liquidation Pattern.PNG
    Liquidation Pattern.PNG
    101.6 KB · Views: 11
Last edited:
Attached below, is our chart markup (transition
Asia-London to US Session).

In this case the Market gapped down in anticipation
of significant economic news. The gap produced a
negative skew, which in turn created an opportunity
to profit, IF the trader were keeping up with current
events

For tomorrow we anticipate the following in order
of preference

1) Reversal up, failure, then continuation back down

2) Reversal up, failure, then sideways (trading range)
for the balance of the day

3) Strong reversal up as buyers enter to trap "bears"
 

Attachments

  • Sunday Transition.PNG
    Sunday Transition.PNG
    149.4 KB · Views: 7
And here is a closer look at the short opportunity
that we saw after Asia opened.

We talk about "planets aligning" often and this means
that a series of events are taking place concurrently
The computers that monitor markets don't sleep
and the algorithms are activated when the context
suggests a potential profit is available.

The broader context is simple. Behind it all, is anticipation
of economic or political news. After that the markets start
to activate buying or selling (this is called "first impulse").
This signals other institutions that a move (opportunity)
is possible. Skilled persons managing the programs enter
at this point to evaluate and make decisions. Once the broader
context is confirmed, the algos kick in and the rest is automated.
We look for the following

1) First impulse move
2) Response to that move (occurring within 30 min)
3) Price pattern suggesting a continuation or "TR" (trading range)
4) Developing setup, which for us is a simple Breakout or 1-2-3 Algo entry

Recognition is what this is all about. Its there (right in front of everyone
but goes unrecognized for the most part). We use a variety of volume based
tools to make the patterns easier to see. We do not post them here.

Good luck
 

Attachments

  • Short Trade Example.PNG
    Short Trade Example.PNG
    64.5 KB · Views: 9
As we get closer to the US session open, we see typical price action
behavior prior related to the known economic data (US Tariffs going into
affect) and the pending news (S&P Global PMI & ISM PMI).

Looking at the most recent chart attached below, we see price rotating "around"
the VWAP Median. As mentioned, this is typical, and it offered several opportunities
for profit based on the idea that price would attempt to reverse higher after the initial
gap down. The "rule of thumb" is you wait for price to attempt to reverse twice. If price
fails to reverse a 2nd time, you look for a setup in the opposite direction. Ideally you want
to enter at the extremes of the VWAP envelope (as close to the outer band as possible) and
you want to exit at the VWAP median. The most recent setup is shown on this updated
chart. Relatively easy money to take out of the market if one were patient and disciplined.
Both short trades based on a 1-2-3 algo setup, with entry below the 2nd candle

Good luck
 

Attachments

  • Updated Transition Chart.PNG
    Updated Transition Chart.PNG
    136.1 KB · Views: 6
This is the first trade of the US session for me

I won't post another today, because it is distracting
to me to post and trade. This was a small scalp
based on the previous comment and preparation
and the setup was 1-2-3, with short entry below 2
and exit at retest of the open

Good luck
 

Attachments

  • First Trade.PNG
    First Trade.PNG
    43 KB · Views: 8
Here is chart markup for the London Session

This is the screen I use to teach struggling traders

On the left, 10 min candles, on the right Daily candles
I use the same VWAP envelope and 20 period EMA
I also use statistical skew and one other volume related
tool to confirm entries

The benefit traders obtain from using this setup is
improved risk/reward. They learn to enter trades based
on the "trader's equation" AND they learn NOT to enter
trades in the wrong locations (there are specific buy &
sell zones for each session).

At the London Open, price action created two (2) trade
entries based on my preferred 1-2-3 algo. I am not able to
outline the details however the process requires a volume
based confirmation that can be obtained by either the skew
or another tool that I do not disclose (because I have not
finished testing it yet). Both trades were successful (+10)
After these trades concluded, price action transitioned into
a trading range, and should stay that way for the next two (2)
hours, because there is no pending economic news until
about 3pm London time (Jolts Job Openings). The market
expects a neutral report, however the overall tone of the
market is volatile and could continue lower in anticipation of
more questionable policy decisions by Trump.

Good luck
 

Attachments

  • Feb 4 London Session.PNG
    Feb 4 London Session.PNG
    130.2 KB · Views: 7
Last edited:
With 10 Min until the US session opens I had time to
mark this nice trade

Because of the volatility, I have been monitoring the London Open
and these trades represent what professionals call "Layups", meaning
that they are easy to recognize. We use volume profile to (and common
sense) to find points of entry. If you simply scan left, you can see where
a test of the previous open resulted in a strong upside move. The next
time that price was tested, we took the same entry and again it resulted
in a nice move higher. A nice way to start the day with money in my pocket.

Gook luck
 

Attachments

  • 10am London Long.PNG
    10am London Long.PNG
    144.2 KB · Views: 3
I am done for the day.
Unfortunately I am busy building a new home
and that task requires a lot of supervision.

Today they were buying pullbacks, I took several trades based on this premise
(buying at tests of Key References). All of them worked well. I can assure traders
that this is not always the case (random chance always exerts an influence).

Good luck
 
Back
Top