A Professional Approach to Trading Futures

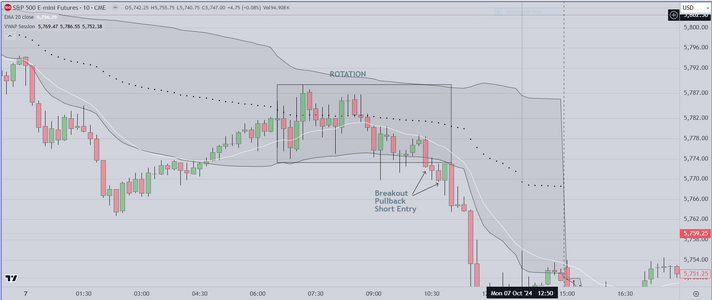
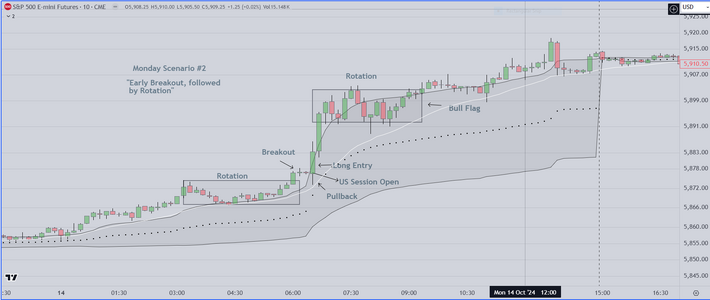
Finally, a couple of scenarios showing how Monday trading
can evolve.

Our advice to struggling traders, and to all retail traders for that matter
is to learn to wait patiently for price to breakout. Trading rotations will
generally result in loss, because amateurs do not know how to recognize
rotation ("also known as "TR" or trading range behavior). Also, they do
not know how to recognize liquidation, which occurs when algos kick in
and false breakouts occur. Learning to read these conditions is critical
and we suggest traders monitor only on Mondays until they learn these
skills as well as how to integrate context (economic news for example)
into their trading plans.
 

Attachments

  • Monday Scenario 1.PNG
    Monday Scenario 1.PNG
    100.4 KB · Views: 31
  • Monday Scenario #2.PNG
    Monday Scenario #2.PNG
    99.4 KB · Views: 14
Finally, a couple of charts showing scenarios for Mondays

We suggest struggling traders "monitor only" on Mondays
until they learn how to analyze (and recognize) price action
and to integrate context (day of week & month and economic
news) into a cohesive trading plan

These two charts show variations on a theme. Rotation, that
either proceeds or follows a Breakout/Pullback Scenario
The first step in the trader's education is recognition. If you can't
recognize "Rotation" it as it develops, you will get chopped up
Also If the trader cannot recognize the difference between a breakout
and liquidation (activation of resting orders or "stop hunts") then
they will also get chopped up (professionals jokingly call this "getting
liquidated"). Better to learn by watching (less expensive).
 

Attachments

  • Monday Scenario 1.PNG
    Monday Scenario 1.PNG
    100.4 KB · Views: 12
  • Monday Scenario #2.PNG
    Monday Scenario #2.PNG
    99.4 KB · Views: 13
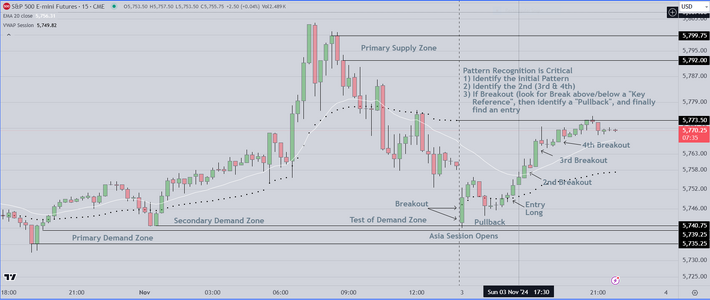
Here is one example of how I create a markup for the
US session, which will open in approximately 8 hours

What professionals eventually learn is that the chart discloses
everything if one learns how to "read" and interpret the data

I have taught traders who were struggling to learn to read the
data, by starting at the most simple level....the Breakout

Breakouts can consist of only one bar (candle) breaking above or
below the next, or a breakout can consist of multiple bars, breaking
above or below a "Key Reference" (such as a VWAP median, 20 period
EMA, a "round number" like 5000 or a "Supply/Demand" Zone). The process
of learning to see these patterns develop takes time, but can be taught. This
setup while simple, has many variations, some of which I have labeled in the chart below

Marking up the chart as I have done here, helps me to prepare for the next session
and is excellent practice for any student of trading.

Good Luck
 

Attachments

  • Breakout Pattern Example.PNG
    Breakout Pattern Example.PNG
    101.5 KB · Views: 12
Last edited:
I hope traders will understand (now) why I suggested
that they do not trade today

Price action is "TR" (trading range) in anticipation of the
election AND economic report releases.

The result is usually early losses
 

Attachments

  • Early Price Action Monday Nov 4.PNG
    Early Price Action Monday Nov 4.PNG
    64.1 KB · Views: 11
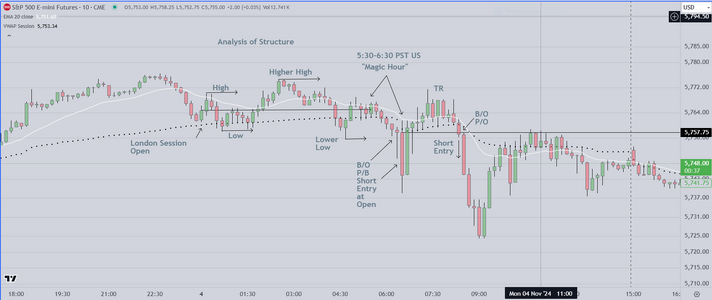
Here is the Markup from today's Emini Session

There were two (2) high odds entries
1) Just prior to the open, analysis of the pre-market (London)
suggested a strong short move.
2) Two (2) hours later, another short move

Both were predictable, that is to say, they occurred at predictable times
of the day, AND were easy (for most professionals) to see as they developed

Pre-Open Analysis, showed a pattern characteristic of a "BOS" (break of structure)
This happens when price creates a higher high, which is subsequently canceled by
lower high and then a lower low into the open. Professionals watch for what happens
during the "Magic Hour" (one hour prior to the US Session Open). As you can see
during that time period, price created a series of bear bars followed by a breakout to the
downside 10 min prior to the open. This telegraphs the intentions of market participants
and the algos (it is called a "flush") It was worth +10, and was an easy trade to take.

After that, we wait for at least 45 min to an hour. Why? because algos (computer programs)
predominate and they create "TR" conditions (Trading Range), as they position inventory
before moving the market. That "followup" was to the downside. Notice that it was on
strong (WRB) wide range bars

As we pointed out previously, this was not a day for amateurs to trade. The price action
between the opening flush and the next opportunity at 8:30am PST, is a trap for those
who thought price would reverse. Amateurs who tried to trade this by getting long between
7:20 am and 8:10am PST found themselves "getting liquidated" (a phrase we have used before).
We suggested early on that retail traders stand aside and wait for the 2nd hour

Because of the American Election, we will not be trading tomorrow. The result should be known
by start of the next session. As an aside, most institutions like Mr. Trump because he intends to
provide tax benefits they want, on the other hand the American public, especially women, think
of him as an ill mannered orange colored pig. I tend to agree with the women.

Good luck
 

Attachments

  • Monday Markup Nov 4.PNG
    Monday Markup Nov 4.PNG
    90.5 KB · Views: 12
Last edited:
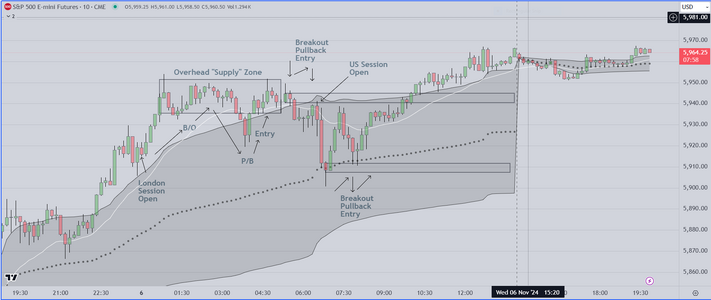
Here is a markup of the previous session

The primary take away is that professionals
think in terms of "legs" consisting of multiple
candles in one direction, followed by a retrace
in the opposite direction, and then resumption
of the original move (which is where they attempt
to enter)

This type of approach allows the successful operator
to find setups that result in swings of at least 5 to 10 points
(depending on local volatility).

This chart also shows the rotations (price ranges where
institutions create inventory prior to moving the market
directionally). For those who want to make the transition
to successful trading, the first step is to see it, as shown
in the chart. Step 2 is learning to see "context", which
requires time and/or the experience that a good mentor might
provide. This unfortunately is much more difficult to obtain.

Good luck
 

Attachments

  • Markup Wed Nov 6 2024.PNG
    Markup Wed Nov 6 2024.PNG
    115.8 KB · Views: 9
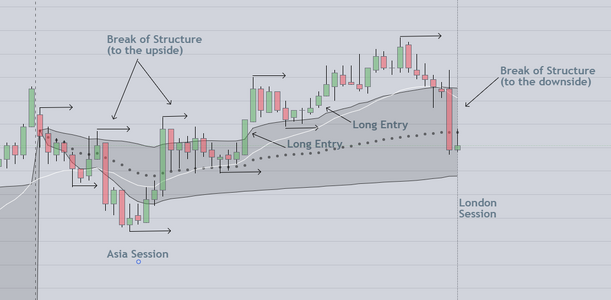
And a Markup of the Asia to London Price Action

This time period is usually quiet, so this is primarily for
practice purposes. The first thing we do is to identify
the high and low swings, in order to determine direction
We also try to identify each "Break of Structure", which occurs
when a series of higher highs and lows is reversed (for example)
This reversal is often accompanied by a change of direction. Once
identified, we then look for either a breakout in the opposite direction
or a "TR" (trading range) followed by a breakout (either direction)

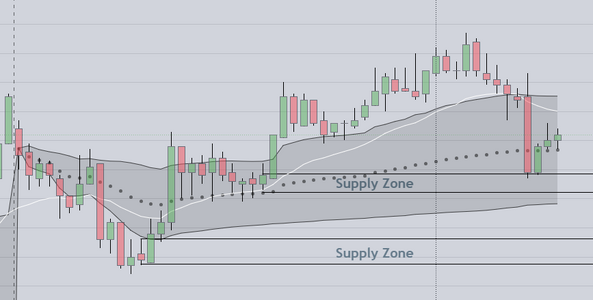
For Chart 2 we use a "clean chart" to show how we identify a "Supply Zone"
This is easy to do and although we don't have time to fully explain, it is part of
every professionals repertoire. Supply Zone entries are marked by a strong reversal
at a specific type of pattern (on the left). As you can see the pattern is a small
bar or candle, followed by a strong move up or down. Price eventually returns
to test and back up it goes (at the point of supply, where resting orders exist)
In this example chart we see two (2) supply zones. Price may decide to test both
of them at some point during this session

This often happens right before the open of a session (we are just a few minutes
away from the London Session open).
 

Attachments

  • Asia to London Markup.PNG
    Asia to London Markup.PNG
    57.5 KB · Views: 8
  • Supply Zone Example.PNG
    Supply Zone Example.PNG
    35.2 KB · Views: 7
Last edited:
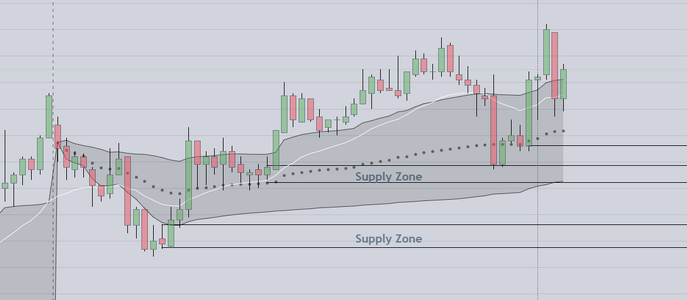
We need to get some sleep, so this is a last post
to show the result of the initial trade

As mentioned, at the open of London Session, price tested
a supply zone, and buyers were there. This was (again) easy
for experienced traders. Why, because the trend is up, and has
been since the American election. The obvious overhead target
is 6000. We will get there pretty soon. So very little risk taking
this trade.
 

Attachments

  • Initial Trade London Session.PNG
    Initial Trade London Session.PNG
    44.7 KB · Views: 11
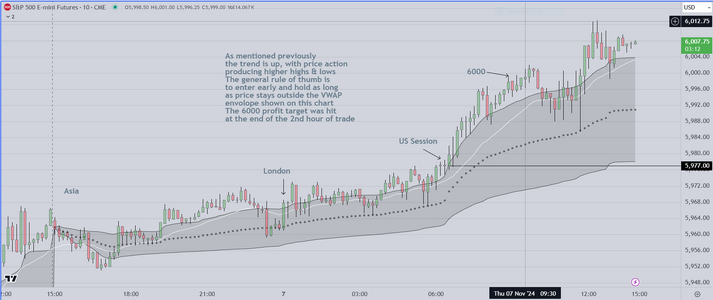
As mentioned in the previous post (last night), the price target or "magnet"
for today's Emini market was 6000. We suggested that a long entry with this
target in mind had high odds of success.

This End of Day Markup shows how that trade played out. The strategy is
simply to enter long soon after the open and hold as long as the candles
closed outside the VWAP envelope. Traders using the position of price relative
to the "envelope" is an old standard way of evaluating the strength of a trend move
that (obviously) still works well. The preferred setup (for us) continues to be
the breakout/pullback/entry price action model, which also continues to work
quite well. Today, we hit our profit goals for the month early. This is common for
experienced traders working during an election season. It is also typical for institutions
to realize significant profit on the basis of known election results. We simply utilize the
same strategy they use (long entries only until the known "magnet" is hit).

From this point forward, we will look for one (1) trade entry that can be held to
a minimum of 10 pts. If that target is hit, we are done for the day.

Good luck everyone
 

Attachments

  • End of Day Markup Nov 7 2024.PNG
    End of Day Markup Nov 7 2024.PNG
    125.2 KB · Views: 13
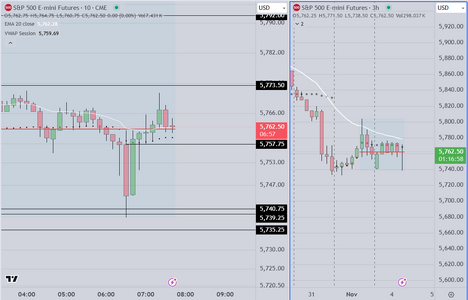
Two (2) Markup Charts

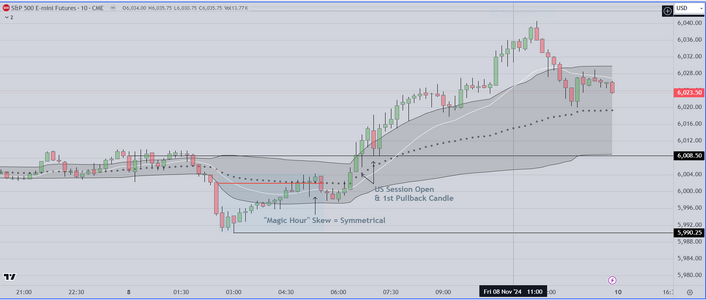
The first chart shows the overnight (from my standpoint) from Asia to London
price action. What we see is a "normal" period of consolidation (also known
as a "Rotation") during which price stays within a range. At about 2pm PST US
price breaks out to the downside. This is called "liquidation", and for professionals
it is a "tell", meaning that those of us who have seen this before KNOW that what is
coming during the transition to the US session, is a reversal. How do professionals
know this? Simple, look at the "skew" in the first chart. It is right on the VWAP (black dots)
and that means that the market is symmetrical (meaning that there is no statistical preference
as to direction).

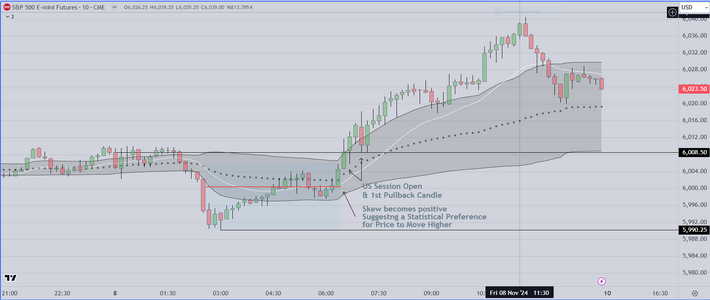
Then move to the next chart and notice as the red line is advanced to the next few candles
that the skew changes (moves lower/under the VWAP Black dots) from symmetrical to positive
(meaning that there is a statistical preference for price to move higher), and that is exactly what
happened. Experienced professionals have seen this movie before (previous elections). Notice
in the 2nd chart on the right that the 6:20 am candles is a relatively wide range bar. This is because
those knowledgeable traders are getting long PRIOR TO THE OPEN. They are willing to take the chance
that the market is going up, and even if it did not, they would be willing to buy 10 pts lower.

As mentioned previously, this month, we hit our profit target early, and so as mentioned in our previous post
we looked for a strong open, got long early and once we had +10, we were done for the day. From this point
forward, we will approach each session the same, looking for one (1) trade that we can hold to +10 points
UNTIL we see a significant pullback or reversal.
 

Attachments

  • Friday Nov 8 Markup.PNG
    Friday Nov 8 Markup.PNG
    89.6 KB · Views: 8
  • Markup 2 Friday Nov 8.PNG
    Markup 2 Friday Nov 8.PNG
    93 KB · Views: 7
Last edited:
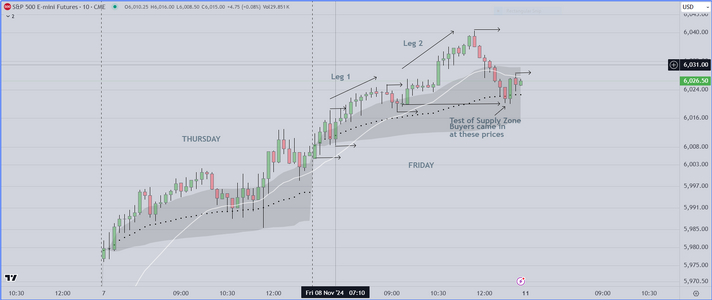
Here is a EOS (End of Session) Markup of a RTH Chart (Emini)

The horizontal arrows are used to outline market structure
by showing (in this example) higher highs & lows, until the
end of the session

Towards the end of session, a reversal occurs and price moves
lower to test a "Supply Zone". These Zones are found by scanning
to the left (we marked this one with an extended arrow)

This system (using analysis of highs & lows) provides structure
and allows us to Identify reversals that could lead to significant
tradeable swings. This analysis also makes it possible to trade
"with" the prevailing trend, and that provides an edge (trades
with the trend have a higher probability of success).

This basic evaluation of price action starts our pre-market prep for the next session
What follows is the evaluation of price action starting with Asia session, carrying on
into London Session and finally we try to solve the puzzle during the "Magic Hour"
which unfolds one (1) hour prior to the open of the US session. During the "Magic
Hour" economic releases hit the market and the reaction often influences the rest
of the US Session.
 

Attachments

  • Friday EOD Markup.PNG
    Friday EOD Markup.PNG
    80.9 KB · Views: 7
Last edited:
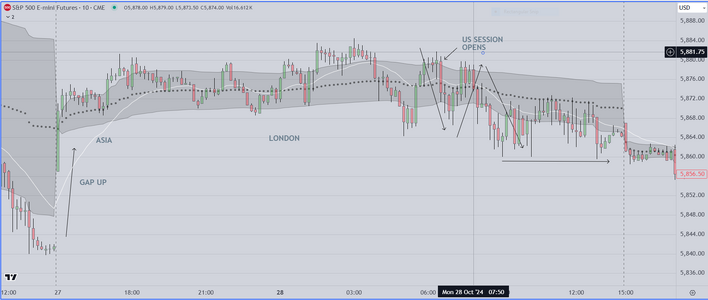
One of the techniques we often use to prepare for the next Monday session (or
any day for that matter) is to go back to the same day, of the previous week
and look at that price action

We attach the previous Monday for readers to check out

As can be seen, this session began with a gap up open (Asia) then it went sideways
until the until the US session open. At that point we see the value of the VWAP envelop
and price extends from one side of the envelop to the other. This (price behavior) is
typical.
 

Attachments

  • Previous Monday.PNG
    Previous Monday.PNG
    117 KB · Views: 8
As mentioned in the previous post

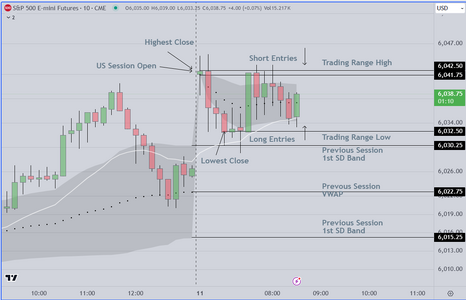
Mondays often exhibit trading range ("TR") behavior. The standard
technique for this type of day, is to frame price action using horizontal
rays to identify the high and low closes. As seen in the chart, it is often
the case that the first high & low closes form the range for the balance of the
session. On those occasions when the range changes, higher & lower closes
can be marked creating a new range.

To trade this kind of day, we wait for the range to be created, then we enter
long (at the lowest close) or short (at the highest close). This allows us to manage
risk, and to avoid being whipsawed by false breakouts.

Good Luck
 

Attachments

  • Trading Range Example 11-11-2024.PNG
    Trading Range Example 11-11-2024.PNG
    71 KB · Views: 8
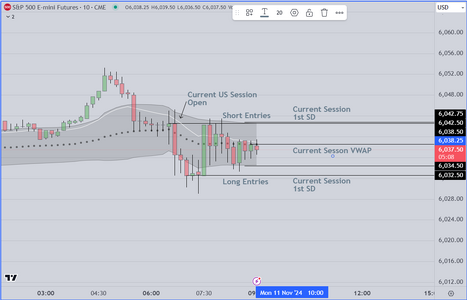
and this is the same chart using the ETH format

As can be seen, the ETH format using the VWAP envelope,
can be used (along with the high & low closes) to create
a "trading range" providing a reasonable way to enter, to
manage risk, and (ultimately) to create a sustainable business
model.
 

Attachments

  • Trading Range Example 11-11-2024.PNG
    Trading Range Example 11-11-2024.PNG
    62 KB · Views: 8
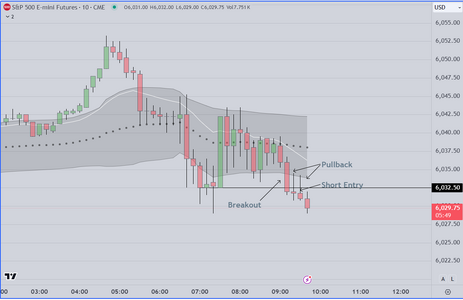
Breakout of Trading Range

This is a breakout/Pullback and Short Entry
to the downside

I did not take this (I was eating breakfast) however
It is a reasonable entry. It is part of the protocol
that was taught in my recent class.
 

Attachments

  • Breakout from TR Example 2.PNG
    Breakout from TR Example 2.PNG
    57.7 KB · Views: 8
Last edited:
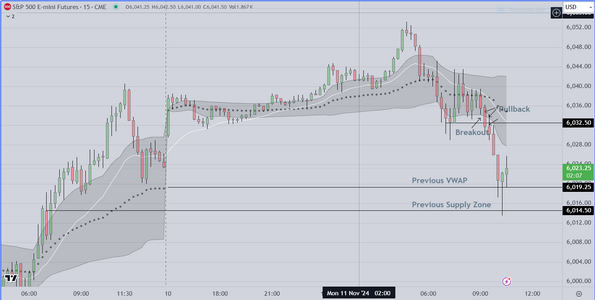
And here is the result of that breakout
and short entry

As seen in the chart, that "reasonable" entry
resulted in almost +20 pts
(our rules for this time period call for mandatory
exit at +10, with possibility to hold one runner)

As mentioned previously we keep in touch with graduates
of our recent class. This morning several were complaining
that they absorbed losses trying to trade the TR (trading range)
early price action. This is not uncommon for retail traders, and
we cautioned (during the class) that it would be advisable for
struggling traders to stand aside or sim trade range behavior.
The last recommendation we offered, was that struggling traders
should "wait patiently" for price to breakout, and trade those
setups in the direction of the skew (or "with the trend" if it is
obvious). We did not show the skew on this chart, however it
would have confirmed the direction (lower prices).

We changed this chart to 15 min candles so that the larger
context can be seen. To the left, we show the previous session
complete with the supply zone marked to show the reversal
that often occurs as institutions take profits on the breakout.
For those with more experience, this is also called a "measured
move", and it is an easy way for skilled operators to make a few
extra points on the reversal.
 

Attachments

  • Breakout Trade Result Mon 11-11.PNG
    Breakout Trade Result Mon 11-11.PNG
    90.5 KB · Views: 8
Last edited:
Changing Your Experience

This is an idea I have had for a long while and will implement shortly

I think one of the problems struggling traders have is that their experience
is largely one of frustration and failure. I think I can help to turn that around

Meanwhile, I have attached a chart showing my trades this morning. The last
short trade still in progress

Additional Note

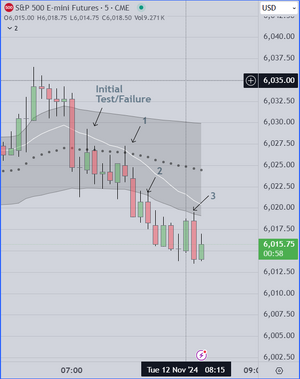
While I was posting this, my short trade hit the profit taking stop. Today is/was
a "TR" (trading range) day early on, and broke to the downside after an initial
test of a "Key Reference". After that test/failure, I simply took the continuation
tests, short of course (in the direction of the obvious trend). It is the process
an analysis that is (we assume) of interest to the struggling trader. It is straightforward
and fairly simple to learn.

Back to work
 

Attachments

  • Short Trades Tues Nov 12.PNG
    Short Trades Tues Nov 12.PNG
    40.8 KB · Views: 8
Last edited:
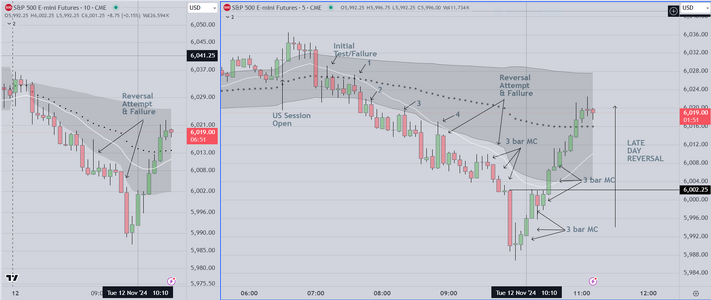
And this is my EOD Markup (I am done for the day)

As one can see, it is important to monitor consistently
throughout the day. This is because the computers and
Algos that drive the futures markets do not rest, or pause
and they use the later part of the day to obtain additional
profits based on their ability to Identify both areas of discount
(where inventory can be obtained below fair value) and areas
where inventory is above fair value and can then be sold subsequently.

Skilled professionals know this and they stay vigilant (as much as one can)
knowing that the potential for profit is always there.

This reversal to test 6000 and the subsequent recovery have the effect of
resetting the market cycle. In the following sessions, we will be holding trades longer (we were
scalping today).

Good luck
 

Attachments

  • Tues Nov 11 Late Day Markup.PNG
    Tues Nov 11 Late Day Markup.PNG
    133.2 KB · Views: 11
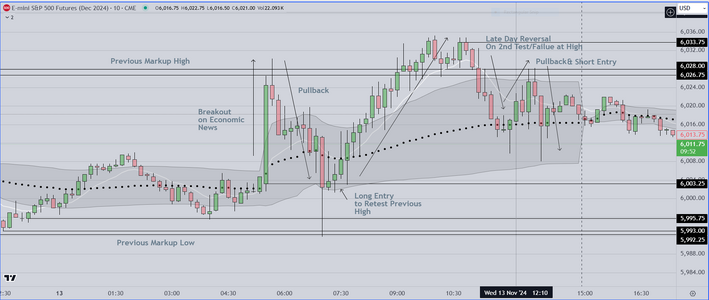
Here is my EOD markup for today (Wednesday Nov 13,2024)

Once again, referring to previous posts, look at how my preferred
setup (breakout/pullback/entry) is performing.

We start with the Magic Hour, which is 60 minutes prior to the US session open
At this point in time, economic news that impacts the US is released. The candle
that starts at 5:30am PST is called an "Event Candle". We evaluate that candle and
the subsequent candles to develop an "edge" so that we can predict market direction
Look at the chart markup and how the breakout model is applied. At the start of the
"Event Candle" price action consists of a spike up to test a previous high, followed by
profit taking as the market pulls back. At the open of the US Session, we see buyers
return to the market and smart traders know that this is the ideal long entry. Professionals
enter, add to their positions, and hold until price re-tests the high.

The balance of the price action that followed is also well understood by professionals
(most of whom follow the breakout/pullback setup).

This was another easy day for skilled traders

Good luck folks
 

Attachments

  • Wednesday 11-13 EOD Markup.PNG
    Wednesday 11-13 EOD Markup.PNG
    126.3 KB · Views: 9
Here is our Pre-Open Summary
for tomorrow 11/14 US Session S&P500 Futures

Economic Reports

5:30am PST Initial Jobless Claims, Consensus 224,000
Previous Report 221,000 +3,000
12 Noon Fed Chair Powell Speaks
-----------------------------------------------

Previous Report Day (Nov 7)

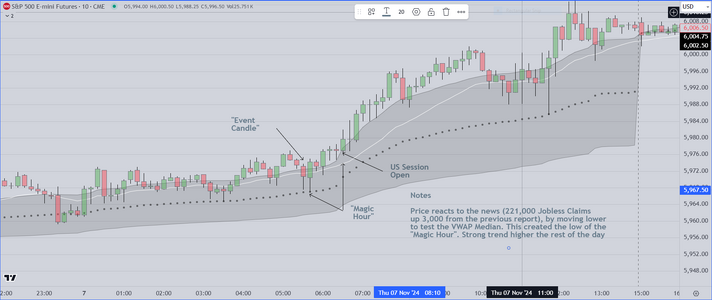
Previous Price Action

Starting with the "Magic Hour" at 5:30am PST, price moved lower to test
the VWAP median. Strong reversal, break to the upside/pullback and "aggressive"
entry at 6am PST. The rest of the session was trend up. +10 within an hour, +20 within
two (2) hours (see chart attached below)

--------------------------------------------------

Strategy

1) Initial Jobless consensus is 224,000, thus odds suggest that we could see similar price action
again tomorrow. If the consensus estimate is accurate, institutions and commercials will act
"aggressively", entering early with the objective to take profits in advance of Fed Chairman
Powell's comments (they want to be out of the market prior to the start of his speech). So
do we. Our objective is to take +10 early, leaving one (1) unit to run with a B/E stop

2) If the Jobless report differs significantly, we will frame the successive highs & lows using
a technique called "bookends". This creates a series of time based ranges, and we will trade
breakouts from those ranges (presumably to the downside). Once again the objective is to
obtain early entry, taking +10 quickly, then exiting the market (as above) prior to Fed Chair Powell's
comments.

For both scenarios, the emphasis is on prompt identification of price action
 

Attachments

  • Previous Jobless Claims Nov 7.PNG
    Previous Jobless Claims Nov 7.PNG
    120.6 KB · Views: 7
Last edited:
Top