YM journal

SOCRATES said:
Ah ! Yes, you see Frugi, you may now percieve more clearly how the appearance of something like this can succeed in misdirecting, causing the wrong decision to be perhaps made, as a direct consequence of inadvertently arriving at the wrong conclusion? Actually it is a very easy trap to fall into, if you are not ferociously vigilant at all times.

SOCRATES

Is there a suggestion that the 'glitches' are deliberate in order to mislead and thereby make a profit ? or are the 'glitches genuine but traders like yourself see them for what they are and are able to take advantage of them ?

Regards

bracke
 
Bracke, on this occasion at least, I think the glitches are merely an error in data provision as opposed to anything tricksy or sinister.
 
frugi said:
Bracke, on this occasion at least, I think the glitches are merely an error in data provision as opposed to anything tricksy or sinister.

Frugi

Thank you for your reply.

I suppose if enough traders saw the glitch and thought it was correct, traded it on the basis of the glitch price, then those who saw it for what it was could take advantage. I suspect that I am getting into fantasy world with this line of thought.

Regards

bracke
 
Hi Frugi you mentioned "A simple self explanatory Grail long today " unfortunately the explanation does not hit me .. Would you mind a brief explanation dear chum...? Is it a simple bounce from the 100 EMA..? . I did try to get in Long on this one but my timing was way off and on the previous low.. for my long i purely looked at the shape. thanks.....
 
No problem gollum,

A Grail long is when the price pulls back to the 100 EMA / 1 min, as you say, in the context of a strong uptrend as crudely signified by ADX (14,14) being above 30 on the 5 minute chart. The target is the previous "obvious" high (yes that's a little subjective I know!). It also works for shorts.
 
Dear Bracke,

I have just seen this, and you are not wrong,
because in the world of trading,
because of the way in which markets are made to operate,
and because ot the way you have to keep your eye on things,
and the slant you have to put on what you see,
therefore, what is, is,
and what is not, is not,
and what appears not, frequently is,
and what frequently appears, is not.

Riddle it is not, but very clear indeed.

I know you understand what I mean by this.
 
Last edited:
A struggle for nowt

-6 from four.

Misjudged what I though was a 3 peak divergence setup when there was plenty of trend left and suffered a bit of slippage on the exit. In hindsight the setup looks dodgy because the 3 RSI bumps are too low in the range: ideally the first bump would be near the top grey line (or above 1000 if you look at the volume scale) but I was swayed by TICK's solid looking divergence pattern, which was probably silly. The stops were a bit loose too.

Two successful trades were a scalp as the morning flag broke up (nearly stopped out at 488 there!) for the regulation 10 pips (TRIN was also diverging from the up trend so I was keen to exit here anyway, even though this divergence proved temporary I could not have known that at the time).

The other a sort of 2pk ND short following a vol climax and then less vol on the new high of 567. Also an upper pivot point, a pretty long topped doji (5min) and a 38% retracement point adding weight to the entry. Covered this at the 100 EMA according to my countertrend rule. (ADX>30 on 5 min,3 indices trending up etc.)

All in all a lot of screen watching for little result. But you all know how much I loathe trends :)
 

Attachments

  • untitled.JPG
    untitled.JPG
    106.1 KB · Views: 223
  • untitled1.JPG
    untitled1.JPG
    312.9 KB · Views: 258
Hi frugi,

Sorry to know you did not have a good day. I thought the moves were pretty clear both yesterday and today, especially in ES.

A 5-min chart of ES is attached.

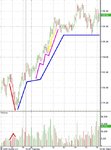
About yesterday. I was watching ES. In the afternoon time I mentioned, from 14:45 to 15:20 there was a controlled down move just ending at the intrday low and the top of the gap, as highlighted by the red line. There were no more sells, and the price began to go up. After that, the moves were pretty clear, as indicated by the lines of different colours.

I got the hint about the big boys from the market depth information. I did not watch YM, but I suspect there was similar information there. This information is proving quite helpful to me, but I would advise to check whether such information can be integrated into your own methods before adopting it, because it can take a bit getting use to, and it could lead to information overload if misused.

I will try to post when appropriate, but as I have mentioned, I am aware that my methods are not always in sync with the thread. Just let me know when to shut up. :)

And really glad to see some p/v experts have resume posting again.
 

Attachments

  • ES.jpg
    ES.jpg
    206.4 KB · Views: 254
Last edited:
Hi frugi,

Sorry to know you did not have a good day. I thought the moves were pretty clear both yesterday and today, especially in ES.

Hi cly,

Thanks. It was my own fault for taking an entry that didn't exactly meet my qualifications (as well as being awful at reading the market!). Still, a small loss is a happy loss when it remembers how big some of its ancestors were. :)

As for the moves, I like the 5 wave patterns you mark, a single wave of one encapsulating another smaller set very neatly. Is this an example of what you mean by "clean" formations and thus perhaps more predictable? I imagine that for the moves to be clear that there are a number of factors involved, but the rather symmetrical appearance of the bars as they relate in the trend may be one of them?

[Off topic - I also remember something Skim pointed out with regard to the volume. As the trend goes up on your chart there are a number of high volume up bars, with the volume generally increasing as the trend unfolds. If you were worried that any of these bars might represent a reversal (as eventually happens a little while after the highest volume bar) all you had to do was wait. If the price went up after one of these bars then you know it is the big boys throwing fuel on the fire, not quenching the trend. How do know this? Cause it's going up! So you can join them in the trend. This is only just making sense to me now, simple though the concept is, it always sounded like hindsight, yet it isn't. Though I may have misinterpreted her somewhat.]

About yesterday. I was watching ES. In the afternoon time I mentioned, from 14:45 to 15:20 there was a controlled down move just ending at the intrday low and the top of the gap, as highlighted by the red line. There were no more sells, and the price began to go up. After that, the moves were pretty clear, as indicated by the lines of different colours.

What makes the move controlled and would would the opposite be? Panic selling, ragged patterns, not instigated by the big boys perhaps? Can you tell who is engineering the move and their intent just by looking at the bar patterns?

Forgive me some amateur "curve fitting": The volume pattern you mark shows decreasing selling pressure followed by quite a bullish bar on higher volume to mark the bottom. There was then a higher high on less volume, showing that the path of least resistance was up, the a pullback bar, then a bar that pierced the higher high set two bars previously, thus confirming the bottom. This bar was almost a bozu as the crowd realised the bottom was in. (???)

I got the hint about the big boys from the market depth information. I did not watch YM, but I suspect there was similar information there. This information is proving quite helpful to me, but I would advise to check whether such information can be integrated into your own methods before adopting it, because it can take a bit getting use to, and it could lead to information overload if misused.

Thank you for mentioning this. Do you mean market depth as in bids & offers posted at various levels around the current bid/offer, with size shown? I imagine to decipher the information is not simple, but might you be looking for certain things such as a lot of size coming into the market on one side, an imbalance between the size on each side, pulling and posting of bids & offers designed to trick etc.? I'm probably way off the mark because I've never looked at market depth. As you say I do not wish for information overload, but if something is useful and I can train myself to understand and incorporate it then I will make every effort to do so. Do you watch T&S as well?

Sorry, what a ridiculous number of questions I've asked! Please don't answer a single one if you don't want to, I know how annoying the third degree can be. :D

I will try to post when appropriate, but as I have mentioned, I am aware that my methods are not always in sync with the thread. Just let me know when to shut up.

No please do not shut up! :LOL: You obviously know your stuff and, without wishing to sound ridiculously selfish, I am very interested in hearing about your methods in as much depth as you are willing to provide. :) It is very generous of you to take the trouble and I am of course very grateful for any advice offered, though sorry I can offer little in return as I am behind you on the trading path, but eager to keep climbing. (This applies to others who add more than the occasional gem too).

And really glad to see some p/v experts have resume posting again.

Yes, the more of them the better :) The sooner I can rid myself of indicators the better! (no offence anyone).

Anyway I've wittered on long enough. I've got a date with market depth tomorrow :)

Have a good evening clylbw.
 
Dull

+10 from one, a scrappy short at 574 when the rising wedge broke, closed at 564.

The rising wedge break looks nasty, especially after A 50% retracement to 620. Retest of 600 and down hard or break through and on to 680 perhaps. I reckon down.
 

Attachments

  • untitled.JPG
    untitled.JPG
    96.6 KB · Views: 247
  • untitled1.JPG
    untitled1.JPG
    313.1 KB · Views: 219
No, Frugi, now it is mischief, not trading. Hands off, Frugi. It is very late in the day.
 
I was referring to tomorrow Soc. :) I hardly ever trade between 20:40 and 21:00 as it is, as you say, frequently mischievous.
 
Yes, all of it very naughty, you need eyes in the back of your head as well. <g>.
 
Hi frugi,

1. I consider that down move a controlled one because of the volume behaviour you have mentioned, its bar formations with lots of tails, and the feelings I had when watching it with the Depth of Market (DOM) info. that there was no panic selling and that somebody was absorbing all the asks.

2. I would say the up moves were 'clean' as ups were in strong in heavy volume and downs were weak in much lower volume. The waves were also very clear with little overlapping.

3. As for the DOM info., I would advise to note the changes in the value and quantity of bid/ask and trades, in context of the stage of the trend. Maybe it is because of my previous experience with the NASDAQ Level II, there always seem to be games being played in the market depth. Personally I have found it helpful to figure out the intentions of the big boys behind such games, but such information should be integrated into one's overall methods.

However, I am no expert in this, or any other area for that matter; maybe some experienced traders can offer more knowledge about this.

I remember there were some good threads about the DOM in ET, but cannot find them at the moment. When I do find the threads, I can send you their addresses if so wished.

Hope this helps. :)

BTW, I also remember the things Skim mentioned. It would be so great if she would post again.
 
Yes that helps a lot, thank you. I suspected you might have been a level 2 player. :)
If you find the relevant DOM threads I'd be very grateful for the links; obviously I'll have a look myself too.

There's a lot of pieces in the puzzle, no mistake.
 
cly,

If you do find those threads on ET, please link them from here. I would love to read them.

HG
 
Choppy, becoming clean

Avoided the nasty morning chop fortunately. The bottom announced itself quietly after meeting the long flag/consolidation target. I suppose there was a volume climax compared to the volume of the last two hours but it wasn't enough to convince me to enter, especially as there was no divergence.

Waited for the 5 waves up, the little stop run to take out stops above HOD (note the long topped doji showing rejection, the traditional vol div pattern [x and y], divergence on RSI and Trinny's lack of support for the latter stage of the rally) to go short. Covered at the 100EMA/bottom of consolidation/magic 64ish.

Result +28 from two (one round trip but 2 contracts).

The consolidation between 19:00 and 20:00 also gave way to a nice measured move.

Not very bullish day - down tomorrow I reckon, though might retest 620 first?
 

Attachments

  • untitled.JPG
    untitled.JPG
    97.2 KB · Views: 199
  • untitled1.JPG
    untitled1.JPG
    349.3 KB · Views: 227
PS Is anyone else in Leeds' NTL broadband out of action cause mine has been for 2 hours? :(
Well, let me know if it was when it isn't anymore! :)
 
frugi said:
PS Is anyone else in Leeds' NTL broadband out of action cause mine has been for 2 hours? :(
Well, let me know if it was when it isn't anymore! :)

"ntl broadband customers in Leeds, Harrogate,York and their surrounding areas will experience a complete loss of service due to a network failure. Our engineers are aware and working to resolve this issue as a top priority- please accept our apologies for any inconvenience that this may cause."

ntlworld.com Service Status.
start time: 20:00, end-time, 20:25.

you should be ok frugi.
hope this helps.
 
Top