YM journal

Thanks very much frugi, it's always heartening to know you're not alone. I'm 18 months into this, so about half way there by your and many others' opinions! I've been watching you development over time, and I'm impressed with what appears to be a control over some of the more important issues. I am getting to grips with my overtrading demons, although I feel they'll always be there. I need to take heed of your good advice in the set-up arena, and stick to it rigidly in terms of "potential" trades. Discretion will always play a part as it does in your approach.
Thanks again for taking the time to post.
Q
 
No probs my man.

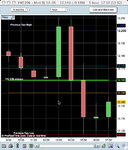
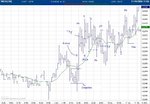
Nice way to end a Friday ... :) Very lucky on that first short. If the #3 bar had been 1 pip longer ...
 

Attachments

  • untitled.JPG
    untitled.JPG
    111.1 KB · Views: 386
Rough delta notes -

Terminology:

Aggressive: Orders to buy the ask or sell the bid. e.g Market, limit and stop.
Passive: Orders to buy the bid or sell the ask. e.g Limit.

Market rises when: Aggressive buy orders eat the whole ask; passive sell orders are pulled from the book until the ask is zero
Market falls when: Aggressive sell orders eat the whole bid; passive buy orders are pulled from the book until the bid is zero.

Aggression shows the highest level of immediate conviction
Aggressive orders may be losing positions getting out at any price (stops).

Effort: Trading activity, i.e. volume.
Velocity: Speed of price change with respect to time. (consensus only momentary)
Acceleration: Rate of increase or decrease in velocity.
Result: Price change for given measure of time or effort.

Effort encompasses: Aggressive effort; passive effort when it meets the former and a trade ensues;
Effort to achieve certain result by aggressive participants can be reduced if passive orders are pulled or increased if they are added.

Professionals will be one, the other or both depending on context.
Amateur more likely to be aggressive (must be when price hits their stop)

Agg paricipants have more conviction but it may be misplaced. Agg. more easily dissappointed if results don't meet expectations?
Agg. in high velocity moves may be late whereas pass. are already in and/or more patient?
Pros may be agg. if they can see it might squeeze an amateur or make him show his hand.

Net delta shifts accompany moves as one would expect. Everyone starts eating the ask and we go up. But do they precede them too, on occasion?

Have also observed bars (usu. time bars) often during pullbacks with heavy bid volume at one end and heavy ask volume at the other that lead to a big move ... possibly due to large positions having been taken (during a fierce battle) followed by rush to cover when it goes wrong way?

Aim: Study level of aggressive ask and bid trades and their effect on price.
Use fixed unit of volume per bar of price change because effort viewed over fixed units of time tends to be irregular e.g far fewer contracts traded in a lunchtime minute bar than one just after a Fed decision. I am standardising the unit of effort because I want the measurement of agg/pass to refer to a reasonable and fixed sample size. (Time) bars containing virtually no effort can give spurious results. e.g a bar in which 6 lots traded at the ask and 1 at the bid is not very useful when the one before traded 300 contracts.

Chart study:

Fixed volume bars, e.g 500 lots
Ask volume per bar
Bid volume per bar
Price change per bar

Cumulative ask volume per day
Cumulative bid volume per day

possibly -

price change / % ask volume (up closes - per bar or day)
price change / % bid volume (down closes -per bar or day )

Latter represents result / effort. What was the level of aggression? To what degree was the aggressors' view confirmed or rejected in light of this? Ease of movement or not? Within context was it a sudden successful or failed campaign or was the status quo maintained.

Split delta into say <10 lots and >10 lots. Does size do summat different to minnow? Is size generally wiser, assuming most size has earned the right to swing it?

Doubts: Is there any real point in making this distinction? Agg/pass ... motive ... whatever ... all that matters is overall effort and result which can be seen in any normal chart. Is it wise trying to distinguish amateur from professional money given the wealth of reasons for trades at any level by anyone .. hedging, arbs, fundamental, scalpers, value / momentum etc.. Do the "pros" and "amateurs" really form discrete groups that consistently do different things at key levels, pre/during breakouts, pullbacks etc.? Do the pros really use their size and skill to test the amateurs volition to enter or exit at certain levels? Information overload - what's wrong with simply following price alone? Unexciting Ross Hooks, 123s, breakouts etc. work if MM is sound. Is the whole attempt at understanding (hidden/overt) condition/cause/effect in the market largely pointless or does it represent the pinnacle of trading? I scalp okay with feel & a few standard crutches, so why not just accept this, size up and stop looking for more clues? The market does not work on fixed mathematical rules. Searching for definable edges is futile in the long term. Thought process beyond a certain level of complexity cannot be programmed. However further kernels of information can still help if one knows how to apply them fluidly.

Future wild gosling chases:

Examine order book delta, i.e % of cumulative ask or bid volume divided by total volume in book
.
Could this be useful?

e.g Heavy ask volume = passive participants think price will rise a few points very soon but not longer term?
While others will see the relatively heavy overhead supply and be wary of buying. Or perhaps they just have - just enough of them for the final flurry to hit those patient, passive asks.

Grr for every thought there is an opposing one that seems to make examination pointless or horribly misleading. Charts start Monday :)
 
Last edited:
Gosh, that's a lot of stuff going on all at once, guess that's wot 'aving a great mind does for ya.
Does size do summat different to minnow? Is size generally wiser, assuming most size has earned the right to swing it?
I have enjoyed a pleasant daydream that I was controlling a few thousands of contracts. I am certain that the temptation would be there to try to move the market around in my favour, make the rest of 'em believe we are going one way, and then whip it back and grab a profit (or whatever). Can't say that this has helped me so far but anticipating these movers and shakers would certainly be a neat trick.
Do the "pros" and "amateurs" really consistently do different things at key levels, pre/during breakouts, pullbacks etc. Do the pros use their size and skill to test the amateurs volition to enter or exit at certain levels?
I find it interesting that an e-mini (NQ say) occasionaly has some individual with a huge block of contracts sitting say 4 levels down in the order book, at the same time as the ER2 or YM has about 4 levels down too. And when a sudden move occurs in one e-mini, another will sometimes jump at precisely the same moment, simultaneous orders preventing the arbing accross the e-mini's that sometimes seems do-able.
I scalp okay with feel and a few standard crutches, so why not just accept this, size up and stop looking for more clues.
Well done, got further than me then! But whatever you're doing, aren't other guys / neural nets or whatever going to figure it out and copy you eventually until you need some new angle, so the research is a necessary part of staying in the game?
pete
 
LOL thanks for the compliment Pete but my mind is 'nugatory' as Stephen Fry might say. Instead of inventing I tend to pinch original ideas, then degrade these noble concepts by turning them into a cheap convenient indicator of limited practical use. :) But once in a while something comes of it, possbily a genuine insight, that adds useful colour to my strategy. The trouble with fingertip technology is that it is so much easier to **** away a day fiddling endlessly with variables and formulae than it is to think logically about exactly what information one wants, why this might be useful and how to present it in a way that maximises utility. e.g I bet if you polled users of RSI only 1 in 10 would be able to tell you how the formula is calculated and thus why the line looks as it does during, say, a divergence. This seems to me to be approaching the problem from the wrong, easy end.

To answer your last question I don't think anyone would be interested in the modest size I'm doing. I feed on the merest scraps, to all intents invisibly.

Besides, if anyone was keen to send a fierce bot after me, I doubt they'd be able to code an algorithm that would consistently and accurately reflect my decision process. I know that discretionary trading must entail a series of ticked boxes of sorts but I still think coding them would be impossible due to the number of variables and unique, subjective way the brain processes them, so I don't worry about it in the way a strict system trader might.

That said resting on (scant) laurels is a definite no-no. I have so much more to learn and to assume what works for me now will continue to do so indefinitely would be arrogant, to say the least. Any trader wants to be in a position where he can do as much size as he can without being silly about it and I am still operating at 1/4 capacity, which shows I am not as confident in my methods as I aim to be. So yes, research and lots of it.

Sorry for a poor answer: my latest delta worksheet has drained any capacity for incisive comment. I'll post the result tomorrow, having eventually settled on a dual display showing <10 lot and >10 lot net deltas below a volume chart. (The bar range divided by delta didn't look promising). Conclusions have yet to be drawn, though there may be a glimmer of insight from delta divergences with price, especially when the minnows go one way and those with sizeable swinging appendages the other.

Meanwhile I need to find out how to extract the order book depth information from IB and stick it in Excel then link that to Sierra.
 
Last edited:
This is some nice scalping opp's from today .... :rolleyes:
 

Attachments

  • ESZ061114.JPG
    ESZ061114.JPG
    95.4 KB · Views: 284
  • alaronifs.JPG
    alaronifs.JPG
    77.5 KB · Views: 259
Last edited:
A wealth of of clean 2 min TTEs, especially if you include premarket (which I never have) - I like it. :D

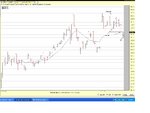
YM stopped me out of one Rh pullback where ES wouldn't have, as shown. The price one pays for a less "blocky" instrument I suppose. Second entry was nice as it followed bounce off vwap and the 50 ema. The 123 at the bottom is wishful thinking as I went for a run and left the stop at 12135 as per trail line.
 

Attachments

  • untitled.JPG
    untitled.JPG
    111.6 KB · Views: 303
frugi said:
A wealth of of clean 2 min TTEs, especially if you include premarket (which I never have) - I like it. :D

YM stopped me out of one Rh pullback where ES wouldn't have, as shown. The price one pays for a less "blocky" instrument I suppose. Second entry was nice as it followed bounce off vwap and the 50 ema. The 123 at the bottom is wishful thinking as I went for a run and left the stop at 12135 as per trail line.

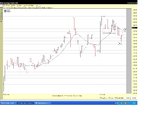
Here is another view of this afternoon's action.
 

Attachments

  • YM Today.jpg
    YM Today.jpg
    118.8 KB · Views: 271
Cheers rols. Yeah the previous HL were handy.

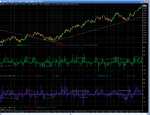
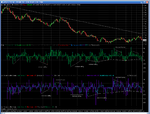
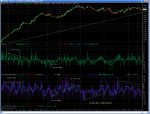
3 charts showing some delta scribbles throughout today.

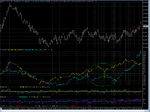
I'm looking at (ask - bid) volume per 200 volume bar, both from <10 lot traders (top study with green bars) and >10 lot traders (bottom study with purple bars). I've added a 3 MA of this difference - net delta - to try and smooth it (green line and bright blue line below) Vertical dotted lines on chart represent 5 minutes - see how they compress during low activity and expand during high activity.

Ignore the little blue and red dots. These appear when on one bar the minnows traded more ask than bid volume while the >10 lotters did the opposite (blue) and vice versa for red. Well I had two more worksheet columns to fill. :)

Due to the 2 second granularity of my data storage unfortunately the 200 vol bars are not accurate, some will be >200, but this does not matter too much.

Excellent day to start off looking at these as it contained several sorts of price action, e.g two reversals, congestion and a brutal rally.

I have marked a few divergences, including the occasional one between <10 lot traders and >10 lot traders. I do not know if there is anything in these but it does look like a new high or new low with a divergence, especially if both groups of traders display one, can give clues about the sustainabilty of the preceding trend. Also it would seem wise to follow the >10 lot traders if in doubt. e.g When the minnows were buying up 15:12 - 15:20 the >10 lotters were increasing their aggression on the sell side and down we went.

My favourite disparity is around 14:55 where the minnows sell more aggressively into the low while the bigger traders do the opposite, paring back their assault on the bids. A reversal swiftly follows at 15:00.

Divergences seemed to work better in the early part of the day. Once that strong trend got going it was hard to derive much sense from them.

My first impressions are that under the right conditions this sort of study might be helpful and what I call divergences are not totally random / meaningless / unconnected with future price movement. Obviously it'll take many more days' study to bolster this view.

However as I intimated earlier, to reduce this information to a study like this and then expect magic under any conditions (let alone all) is likely to be futile. What I am hoping is that it can join the ranks of useful nuggets, such as a channel boundary, Fib level, hammer or vwap line and thus increase the probability of a timely entry or exit.
 

Attachments

  • 1600-2000.PNG
    1600-2000.PNG
    110.6 KB · Views: 265
  • 1430-1600.PNG
    1430-1600.PNG
    98 KB · Views: 250
  • 2000-2050.PNG
    2000-2050.PNG
    97.4 KB · Views: 259
Last edited:
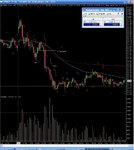
fresh opp Rh after congestion break out
but this Rh is cancelled
 

Attachments

  • $INDU.JPG
    $INDU.JPG
    146.3 KB · Views: 291
  • $INDU.JPG
    $INDU.JPG
    149.1 KB · Views: 294
Last edited:
I like very much the delta ... yagshemash.

Today's YM with cumulative delta split into <10 and >=10 lots. Standard 3 min chart on left for reference.

Vertical lines represent 10 mins.
Yellow line is <10 lot cumulative delta.
Light blue line is >=10 lot delta.
White line is total delta.
Each price bar represents 256 lots traded.

First 12 minutes show a lower low. Pikers hit the bid more aggressively, size does not. Price then rises. Were they bidding and soaking up the pikers? (grey lines)

Three higher highs between approx. 16:00 and 16:30. Another divergence between the two groups. Aggression from size is diminished on the seond and third high while the pikers continue to hit the ask, their delta mirroring price. Market then falls. Were the pikers being stopped out and buying late while size started to soak up this aggression by offering out to them after the high around 16:00? (purple lines)

Stop run (?) at approx 19:00. A similar divergence with a similar result. (pink lines)

Action after 19:30 is interesting. In this case size is the more aggressive seller till 19:43 while pikers were net buyers after 19:28. (red lines). Price then goes nowhere (without this info. one might have expected a rally) and no group displays much conviction. Having previously hit those bids bringing their delta to a new low, size now isn't covering - if it were the price would rise more fiercely. So we expect a new low?

Which we get. There is a divergence of sorts (dark green lines) which might suggest the pikers are stopped out / take new shorts on the new low while there is no aggressive selling from size. Were they covering? One might think so as price then rallies.

The close is interesting. Size sells aggressively into it while the pikers buy resulting in a 1000 delta difference between the groups. Does this tell us anything?

What interests me is that size often seem to pre-empt moves and this is shown in their aggression levels either diverging (new price high, less buying aggression) or reverse diverging (not a new low with increased selling aggression). In the former case we might see a new high that marks a reversal, in the latter a higher low that does not lead to a rally, indeed a new low prints soon after, albeit briefly. Meanwhile the reactive pikers are often too late (buying the top) or too early (buying the low that isn't) and find themselves in poor value positions which soon add fuel to an opposite move.

More to follow. Wooly brain overwhelmed.
 

Attachments

  • untitled.PNG
    untitled.PNG
    192.1 KB · Views: 302
Last edited:
Eek it's spewing out now and probably all speculative rubbish anyway.

Exchanges between pikers and size (strong) facilitate reversals. Pikers then become trapped in weak positions from which they rush to exit once price has move a sufficient amount against them. At the point size is holding and enjoying their pain, the Shell V-Max of fuel. So, divergences between commitment of two groups on new highs or lows may give clue to an exchange in progress? The weaker group is aggressive, either being stopped out or paying the bid/ask for a new position (shown by its cumulative delta rising/falling in line with price) while the stronger group appears less so (shown by a divergence in price and its cumu. delta). Is this because they are operating passively at these points, supplying the late aggressors with what they think they want?

Often price is moving steadily on one direction and everyone is on the same side, with their respective deltas mirroring price. This may show that the move is currently healthy and sustainable. When a divergence starts showing up, tis a warning.

Another thought. Can the net delta at the close give clues? For instance imagine 3 strong up days during which the net total cumu. delta closes at +1200, +800 and +50. Is this a sign of weakness, especially if the aggression reduction is concentrated in size players?

Can the total cumu. delta be linked top open interest at all? i.e. Is there a chance of roughly deducing who is net long / short at the close by looking at the change in OI with the change in net cumu. delta? Knowing this would be very useful. e.g. If we know pikers have been more aggressive on the short side near the close and their net delta is -big while size hasn't then we know that the pikers are asking to be squeezed on the morrow.

Trouble is, even if we know the net delta we don't know how many of these trades were buys to open or stop buys to close. e.g A piker delta of +2 could indicate one piker who has bought to open, then bought higher to close, i.e. no increase in OI. Aaargh. But I'm sure there's something useful to be gleaned from the totals all the same, I'm just too dense to work it out. Still, I'll start a daily spreadsheet that notes the pikers', size's and total delta and price change and see if it tells me 'owt after a few weeks.

This is probably wandering into fantasy territory so I will stop and think a while longer. Hmm a while being about five years with no breakthrough I reckon, then I promise I'll give up and stick to bloody Ross Hooks for eternity. :) No offence to Mr. Black by the way - please keep posting 'em sir.
 
Last edited:
More tradeable divergences today. I took the total delta line off today as it was in the way. I won't comment on all of them since they are sufficiently visually striking.

C warned not to buy the HL. E was the best, 3 HHs with diminishing interest from size and increasing enthusiasm from the pikers. Each divergence peak could be traded for a swift pullback scalp and the whole series was also a warning to exit longer term longs, perhaps on 2nd or 3rd peak if lucky.

Dunno what happened at F. Size sold it down hard but the pikers wouldn't budge. Next thing we know both groups are hitting the ask up to the third high. A failed fishing expedition perhaps? If we can't get 'em to dump then we'll get 'em to buy a weak new high instead. Hmm.

I'm beginning to think these delta readings will add something useful to the armoury, though I appreciate that they look better in hindsight. I'll be interested to see how they act on a one way trend day though, as I have a suspicion that (as with stock momo indicators) divergences will cease to provide particularly useful signals.

BTW I know that dividing the market at 10 lots into two imaginary groups, one of whom is assumed to be skilful and the other silly is both shamelessly arbitrary and an insult to many profitable "pikers". :) But I think it is fair to say that there are probably more losing 1-10 lot traders than >10, taken as a whole? *dons flame suit*

Also many >10 lot trades will not be directional and thus possibly misleading.
 

Attachments

  • pikeys.PNG
    pikeys.PNG
    131.4 KB · Views: 452
Last edited:
A mixed bag for the "visual filtered time and sales indicator".

Much more enthusiasm from pikers for the morning spike, especially during the last few bars (purple ellipse). This served as a warning that the new cash high wasn't sustainable. On the standard 2 min chart there was a dirty inverted hammer with highest volume of day as well, which helped confirm this.

Market then sold down steadily with pikers and size delta confirming apart from a minor divergence between 14:50 and 14:57. Perhaps size tried to hold the price then sensing failure reversed during the inverted hammer c15:00?

The pink line shows a piker / size divergence on the LOD but annoyingly the pikers seemed to be right this time. This brings a dilemma to the table. Is any divergence better than none?

I was thinking that when there is a piker one (i.e. a LL in price, a HL in delta) while size confirms the LL with a delta LL that I should ignore the pikers... but today theirs was a good signal. Ha! No magic formula for all situation to be found here, as ever. :)

After 16:00 volume and range was very poor which is my excuse for not understanding the divergences within the green ellipse. I suspect that most of the size activity may have been bots and arbs providing spurious directional clues, so no need to try and read too much into the delta here?

The action between the red lines was interesting and the indicator's best heads up today. It looked like a breakout might be in the offing after the HL at 12340 and you can see size being very aggressive prior to it, especially in the red circle. At the same time it looked like the pikers were trying to short the 345 -350 area (or at least surrender longs) which helped as some would be forced to cover on the BO. This piker /size divergence served as an excellent warning and lo the price broke to 10360 (okay only 10 points and after the close, but was worth a scalp).
 

Attachments

  • deltaminus.PNG
    deltaminus.PNG
    90 KB · Views: 283
Last edited:
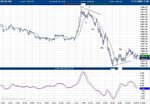
YM delta and breadth during savage reversal.

Blue line (>10 lots) neatly supporting both trends. Noteworthy divergence from panicked pikers on LOD and late stage of uptrend. General divergence on HOD worth a few hindsight pullback points.

Also 17:50 - 17:55 ish when price churned at the lows everyone started hitting the ask ... delta went up and price didn't for a while ... but was this a tip off that price would soon rise as final passive supply was hoovered up.

Some shallow breadth divergences.

Just noting the look of things down for reference cause today was kinda active.

Up another 100 tomorrow then? :)
 

Attachments

  • for-reference.PNG
    for-reference.PNG
    113.5 KB · Views: 258
  • for-ref2.PNG
    for-ref2.PNG
    231.9 KB · Views: 263
Last edited:
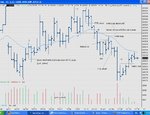
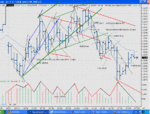
This is old YM chart whit your entries I draw some Chanel lines and mark the Volume Gaussian-s.....
 

Attachments

  • untitled.GIF
    untitled.GIF
    108.1 KB · Views: 323
Someone asks:

What is the point in using “targets”?

“I see many use "targets" as exit rules. Like sell when price rises 10 points from where I bought; or sell if price drops 2 points from where I bought.

But the market price does not depend on where you bought! So WTF?”

Jack Hershey responds:


Targets are inventions of traders. And the market does not put targets up on a screen.

Targets could be thought of as parts of trading approaches. The reason they are there is to complete a trading approach.

So targets originate some time in the process of creating or refining a trading approach because they fulfill a trader’s need.

What need does the trader express when he invents a target as part of a trading strategy?

There may be many ways the target satisfies a need or needs. Any trader can go back over his notes on where he introduced the target and, there, he will find out why he did it.

He will notice it has something to do with his entry. This can be deduced by looking at the equation that was made to get the value of the target. The equation says “Target equals entry, and some arithmetic follows and then a numeric value appears". This has nothing to do with the market and everything to do with what the trader was inventing at the time.

This step in creating an approach has the most to do with limiting the profits a trader will make, more than any other feature of his final approach.

Most of the time it is an afterthought and it is a replacement for the trader’s original exit approach. The original exit approach didn’t work, probably.

Looking at the seasoning process a trader goes through on the way to failure or success, the target is a critical step along the way.

Let’s look at the path to failure first. Targets are created along this path.

Let’s look at the path to success. Targets are removed somewhere along this path if they were ever instituted.

Adding or deleting targets is more important than the creation of most other single aspects of the trader’s methods or approach. It is the place in time where the trader either lets the market talk to him or not talk to him.

A trader who gets to understand his partnership with the market does not use targets. It is the market’s job to determine some things. Included in these are two important things: entries and exits at first, then, later when they are not used anymore, holds and reversals.

Why do targets for exits go away? It is mostly because exits go away. Exits are replaced with reversals when the trader understands his partnership with the markets.

As has been said, “It is obvious to everyone that an exit signal is an entry signal in the opposite direction”. Actually, it was said last week after the person read the statement which he was reviewing while he looked for something he wanted to criticize.

Seriously, when a person has determined his partnership with the markets and when he lets any market do the job of giving him segments of profits one after another, what has led him to that place?

It may be the realization that the market talks to traders and says things that are always correct and at the correct time.

These messages may not be seen by many simply because they are not on display. Displaying the markets is part of the creative process. If a trader is creating an approach and he cannot see the markets nor the roles the market plays, he is going to have to go to great lengths to make up for these shortcomings. Well, isn’t he? More precisely, aren’t you?

Is it arrogant and condescending of me, the writer, to ask? Maybe not. I am in support of a person going up a path to excellence. Let’s tip the path upward first.

The markets unfold. They do this over time. It may take years for them to display themselves.
Markets: show me the partnership and show me what you have to say. Either do it from details building into concepts or do it by showing me the concepts and break them up into pieces that I can collect and make use of.

The market will tell you both. Groups of pieces are needed to see conclusions which are related to the principles of the market.

This is so difficult to do for traders because they feel, want and desire to make decisions most of all. The market makes the decisions, however. The trader hears what leads to decisions as the market talks to him all the while.

How does a trader really create a trading approach? Read about it. It is done by paying tuition and waiting a long time to find out. The Holy Grail is the name of something that is sought after. None of these things is a very good idea at all. They lead to limitations that may turn out to be overpowering and, if this path is used, it leads away from success.

People aren’t built, naturally, to be traders. So, most people cannot go through the adjustments to become traders. Naturally, nature takes care of most people by simply conducting them, as effectively as possible, away from trading. Most of the time it comes down to taking their money away or not letting them make enough to make it worthwhile (compared to other survival missions they ultimately accept as their life experience).

The way down to the exit is filed with the emotions nature provides as gravity: fear, anxiety and anger. These turn out to be the three gauges a trader on the path uses to test his progress. The trader going upwards to success enjoys support, comfort and confidence. If a tinge of fear, anxiety or anger becomes present, it is an immediate caution that something is awry in what the trader is sensing. In other words, the market is not talking to him or, more important; he is preventing the market from talking to him.

The markets do not do targets.


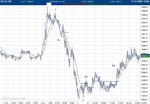
Clean geometry on YM today, for the archive....a technical day. Once I'd seen two impulses down and two retacements, shorting the top of the second one i.e wave 4 (16:30ish) at the channel top boundary seemed like a good idea. Exit near bottom of consolidation at the 45 pt target. Once we broke out upwards from this channel at 20:00 there were two decent Ross Hook style pullback trades (buy penetration of the high of up to 4 pullback bars i.e 20:04 and 20:18)

So, a target was used in the first case to measure the likely retracement length (for entry) and to project a symmetrical run down of x points (for exit: wv 5 might and did equal wvs 1 &3) [exit also near a gap fill]. But not in the second: in the case of the RH trades moved stop up with proprietary Kiwi trailing stop line (dark grey) and exit on close. In an ideal world lol ... actually I took some off at VWAP (20:14) like a coward.
 

Attachments

  • prettywaves.PNG
    prettywaves.PNG
    82.1 KB · Views: 299
Last edited:
Top