SuperDriveGuy
Active member
- Messages
- 129
- Likes
- 1
Hi Geofract
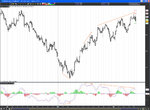
I am learning a lot from this thread.Please can you elaborate on this point... How do you pinpoint the divergence?
--------
Lots of divergence on the RSI notice
-------
Thanks
I am learning a lot from this thread.Please can you elaborate on this point... How do you pinpoint the divergence?
--------
Lots of divergence on the RSI notice
-------
Thanks